Zum Inhalt der Seite gehen


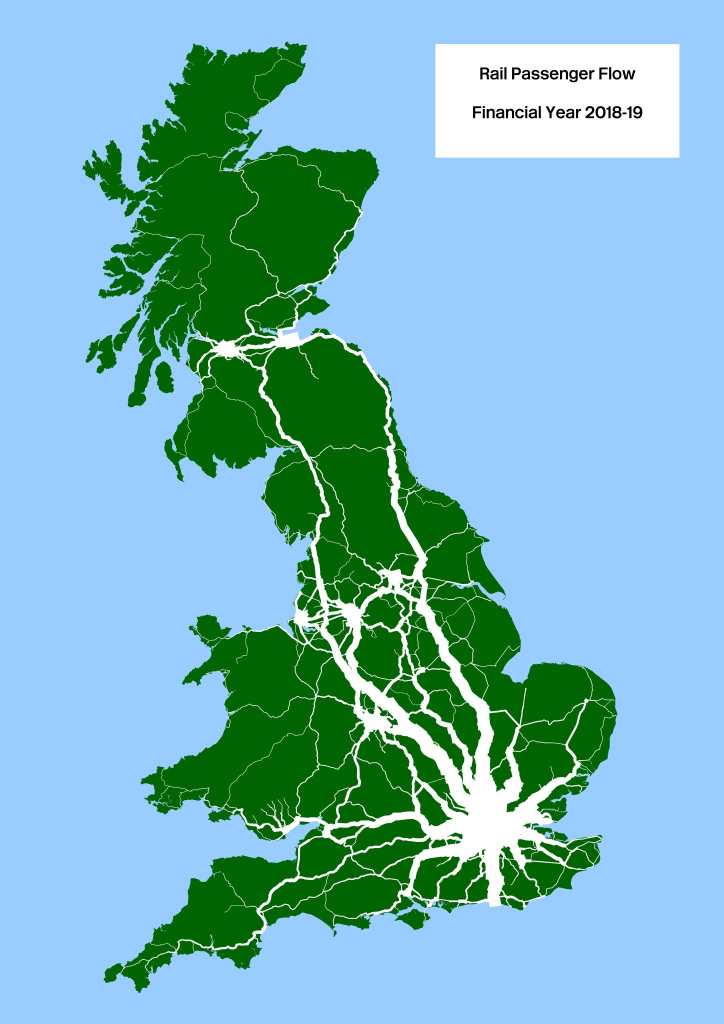
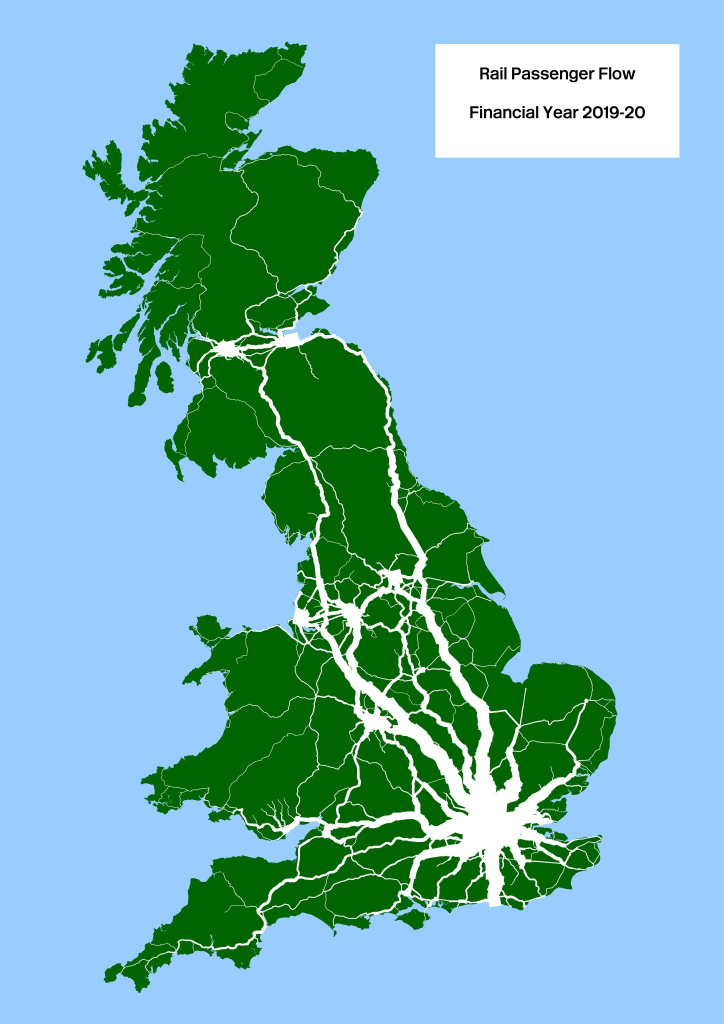
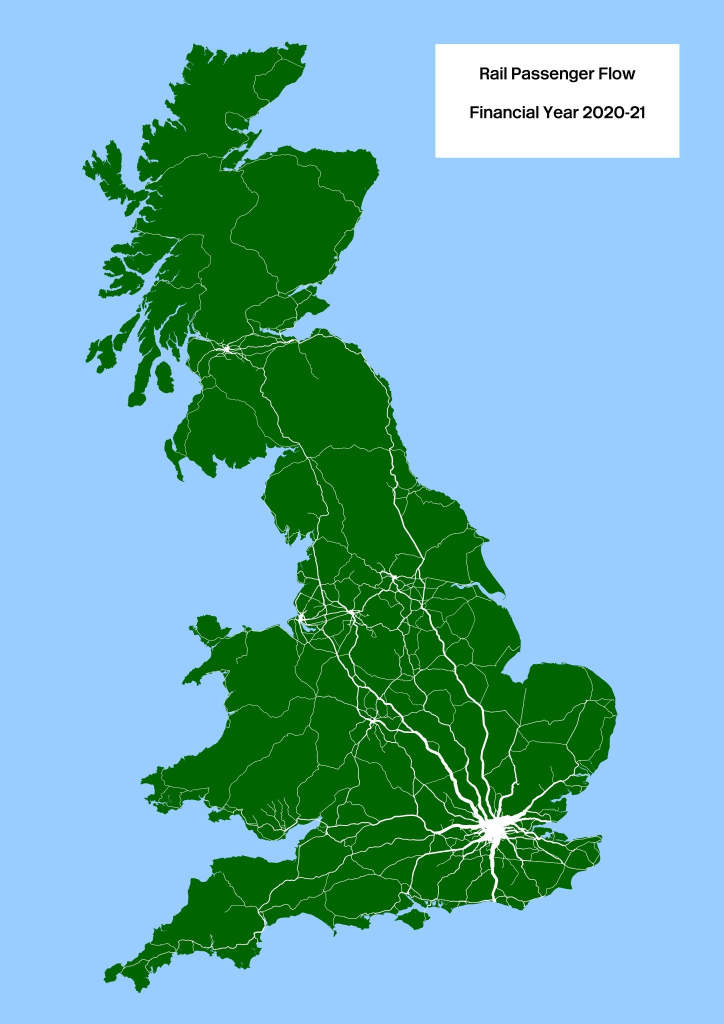
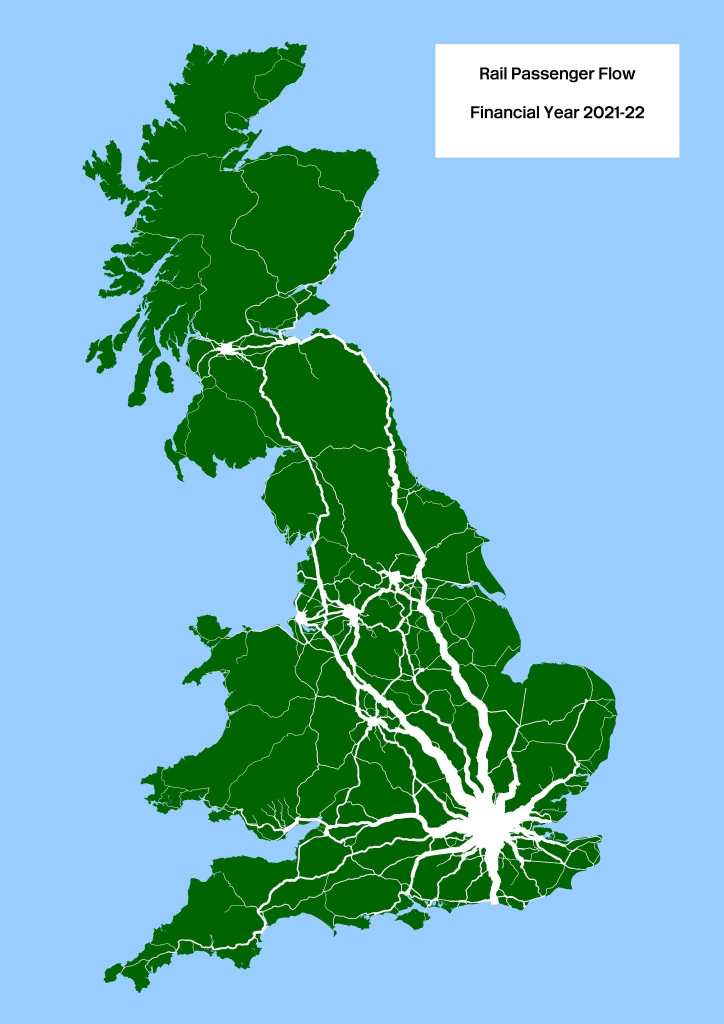
For those interested in such things I've been working the 2018-2021 #ORR Origin Destination Matrix (#ODM) dataset and have got these three up and together. I was planning to publish these along with the individual station flows this weekend and then 2022-23 dataset dropped today.

#rail #dataviz #passenger
Map of Britain in dark-green in a blue sea with aggregated ORR  passenger flow numbers for 2018-19 projected onto the centre-line track-model in white where width indicates passenger numbers
Map of Britain in dark-green in a blue sea with aggregated ORR  passenger flow numbers for 2019-20 projected onto the centre-line track-model in white where width indicates passenger numbers
Map of Britain in dark-green in a blue sea with aggregated ORR  passenger flow numbers for 2020-21 projected onto the centre-line track-model in white where width indicates passenger numbers
Map of Britain in dark-green in a blue sea with aggregated ORR  passenger flow numbers for 2021-22 projected onto the centre-line track-model in white where width indicates passenger numbers
Dieser Beitrag wurde bearbeitet. (9 Monate her)
...and here is the 2022-23 ORR data...
Map of Britain in dark-green in a blue sea with aggregated ORR  passenger flow numbers for 2022-23 projected onto the centre-line track-model in white where width indicates passenger numbers

Doug Webb hat dies geteilt

I took some of the almost invisible lines recently, enjoyed.

Great diagrams, even if it does make London look like a cancerous octopus