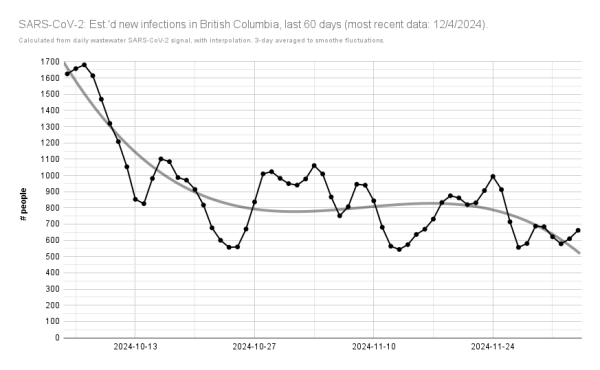
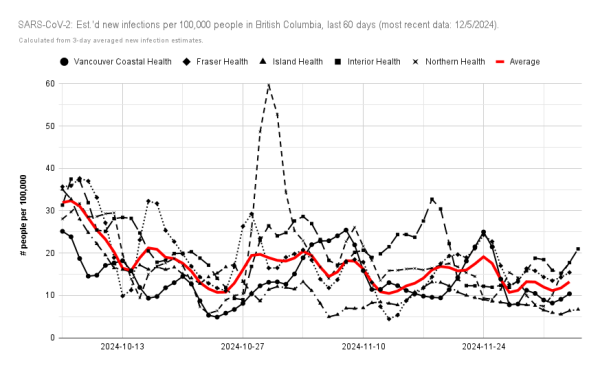
🧵UPDATED: #BritishColumbia est.'d #COVID19 cases, the same per 100,000 pop. by health authority.
According to #BCCDC wastewater #SARSCoV2 data: on average, from 11/28 - 12/4, there would've only been 632 cases/day in #BC (⬇️ 819, 11/21 - 11/27).
https://anarchodelphis.tumblr.com/BCWastewater 1/5
According to #BCCDC wastewater #SARSCoV2 data: on average, from 11/28 - 12/4, there would've only been 632 cases/day in #BC (⬇️ 819, 11/21 - 11/27).
https://anarchodelphis.tumblr.com/BCWastewater 1/5


Ms. Opossum graphs COVID data. •
According to #BCCDC ww. data: on average, from 11/28 - 12/4, there would've been 118 & 288 cases/day in the Van. Coastal & Fraser HAs (⬇️ 217 & ⬇️ 381, 11/21 - 11/27).
https://anarchodelphis.tumblr.com/BCWastewater 2/5
Tumblr
TumblrMs. Opossum graphs COVID data. •
According to #BCCDC ww. data: on average, from 11/29 - 12/5, there would've been 57 cases/day in Island Health (⬇️ 76, 11/22 - 11/28).
https://anarchodelphis.tumblr.com/BCWastewater 3/5
Tumblr
TumblrMs. Opossum graphs COVID data. •
According to #BCCDC ww. data: on average, from 11/29 - 12/5, there would've been 144 cases/day in Interior Health (⬆️ 101, 11/22 - 11/28).
https://anarchodelphis.tumblr.com/BCWastewater 4/5
Tumblr
TumblrMs. Opossum graphs COVID data. •
According to #BCCDC ww. data: on average, from 11/28 - 12/4, there would've been 35 cases/day in Northern Health (⬇️ 40, 11/21 - 11/27).
https://anarchodelphis.tumblr.com/BCWastewater 5/5
Tumblr
TumblrHugs4friends ♾🇺🇦 🇵🇸😷 hat dies geteilt