Zum Inhalt der Seite gehen


Wow—

The National Oceanic and Atmospheric Administration ( #NOAA )called out a rapidly warming Arctic in December of last year.

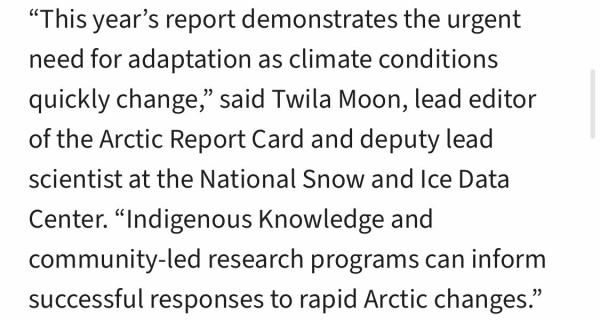
“This year's report demonstrates the urgent need for adaptation as climate conditions quickly change.”

-and-

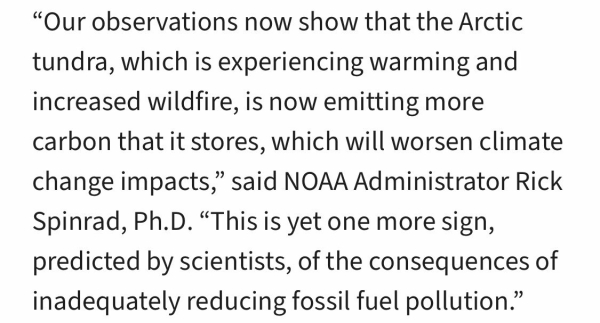
The arctic tundra is “now emitting more carbon that it stores... yet one more sign... of the consequences of inadequately reducing fossil fuel pollution.”

#climate #ClimateChange #USA #environment

https://www.climate.gov/news-features/understanding-climate/2024-arctic-report-card-documents-rapid-dramatic-change

(I archived the main page so far.)
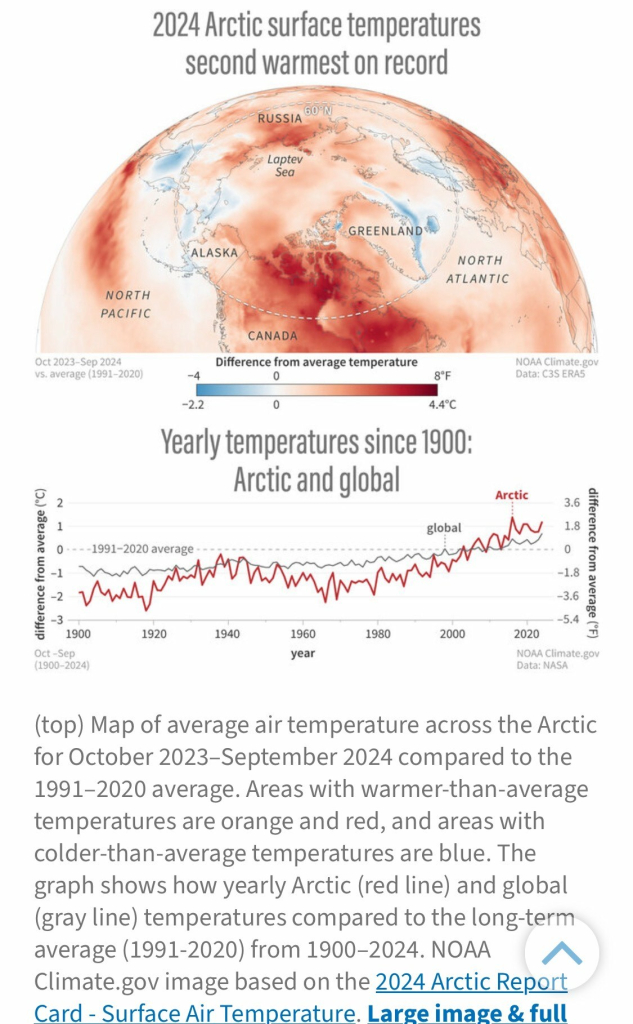
2024 Arctic Surface Temperatures Second Warmest on Record Russia 60 ° N Lapetv Sea Greenland Alaska North North Pacific Oct 2024 vs. Averge (1991-2020) Canada Difference from Averaging Temature ERA5 -4 8 ° F -2.2 4.4 ° C Yearly Temperatures Since 1900: Arctic and Global Difference From Averge (° C) -3 1900 Oct -sep (1900-2024) Arctic 3.6 1.8 -1991-2020 Average 0 -1.8 -5.40 Year 1980 2000 Difference from Averge (° F) 2020 Noaa Climate.GOV Data: NASA (Top) Map of Averge Air Temperature Across the Arctic for October 2024 ComparedMber 2024 Compared to the 1991-2020 Average. Areas with Warmer-Than-Averge Temperatures Are Orange and Red, and Areas With Colder-Than-Average Temperatures Are Blue. The Graph Shows How Yearly Arctic (Red Line) and Global (Gray Line) Temperatures Compared to the Long-Term Averge (1991-2020) from 1900-2024. Noaa Climate.gov Image Based on the 2024 Arctic Report Card - Surface Air Temperature. Large Image & Full

https://www.climate.gov/news-features/understanding-climate/2024-arctic-report-card-documents-rapid-dramatic-change

Accessed: 28 March 2025 at 2010 MST
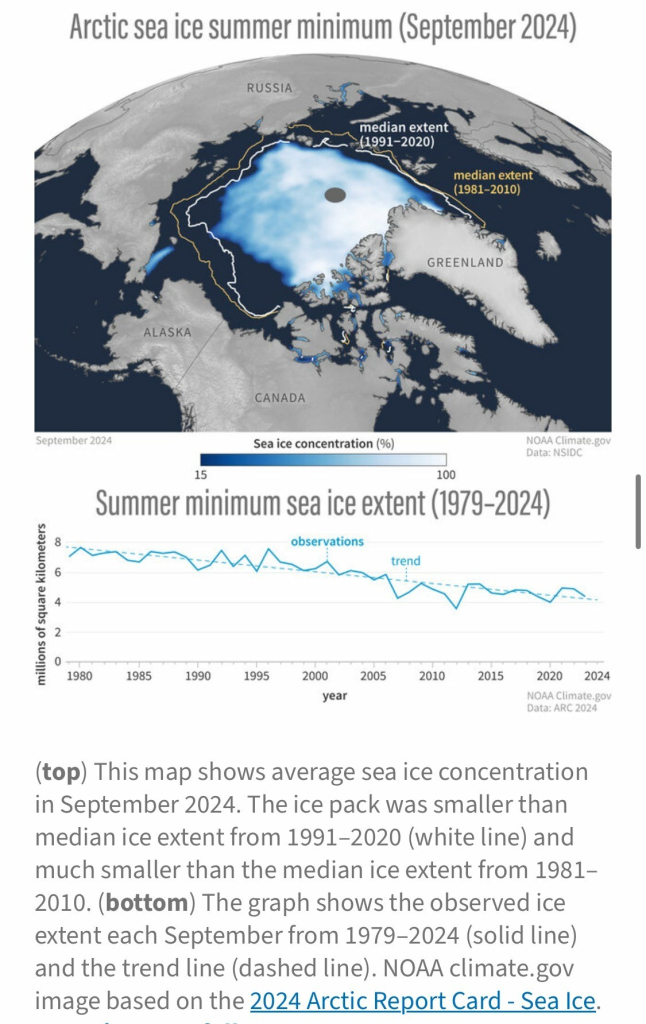
Arctic sea ice summer minimum (September 2024) RUSSIA median extent (4991-2020) median extent (1981-2010) GREENLAND ALASKA CANADA September 2024 Sea ice concentration (%) NOAA Climate.gov Data: NSIDC 15 100 8 Summer minimum sea ice extent (1979-2024) observations trend 4 2 01 1980 1985 1990 1995 2000 year 2005 2010 2015 2020 2024 NOAA Climate.gov Data: ARC 2024 (top) This map shows average sea ice concentration in September 2024. The ice pack was smaller than median ice extent from 1991-2020 (white line) and much smaller than the median ice extent from 1981- 2010. (bottom) The graph shows the observed ice extent each September from 1979-2024 (solid line) and the trend line (dashed line). NOAA climate.gov image based on the 2024 Arctic Report Card - Sea Ice.

https://www.climate.gov/news-features/understanding-climate/2024-arctic-report-card-documents-rapid-dramatic-change

Accessed: 28 March 2025 at 2010 MST
"This year's report demonstrates the urgent need for adaptation as climate conditions quickly change," said Twila Moon, lead editor of the Arctic Report Card and deputy lead scientist at the National Snow and Ice Data Center. "Indigenous Knowledge and community-led research programs can inform successful responses to rapid Arctic changes."

https://www.climate.gov/news-features/understanding-climate/2024-arctic-report-card-documents-rapid-dramatic-change

Accessed: 28 March 2025 at 2010 MST
"Our observations now show that the Arctic tundra, which is experiencing warming and increased wildfire, is now emitting more carbon that it stores, which will worsen climate change impacts," said NOAA Administrator Rick Spinrad, Ph.D. "This is yet one more sign, predicted by scientists, of the consequences of inadequately reducing fossil fuel pollution."

https://www.climate.gov/news-features/understanding-climate/2024-arctic-report-card-documents-rapid-dramatic-change

Accessed: 28 March 2025 at 2010 MST
Dieser Beitrag wurde bearbeitet. (4 Tage her)