Suche
Beiträge, die mit wastewater getaggt sind
Aug 21, 2024
https://stanford.zoom.us/webinar/register/WN_uw7p4_ZOSa-x_CZiAYdw9w#/registration
#COVID #LongCovid #Wastewater
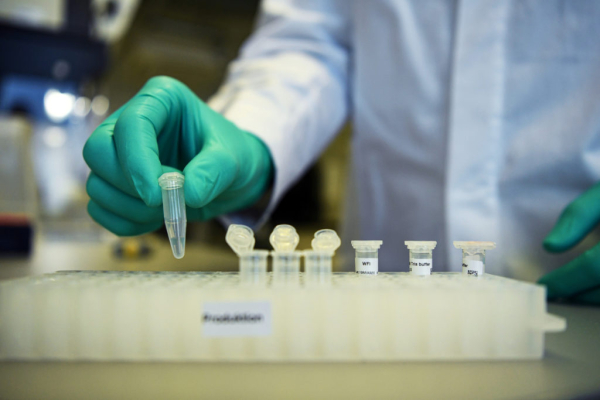
5 years after it appeared, things we know and still don't know about COVID
Five years after the virus that causes COVID emerged in China it still holds some mysteries.PBS News
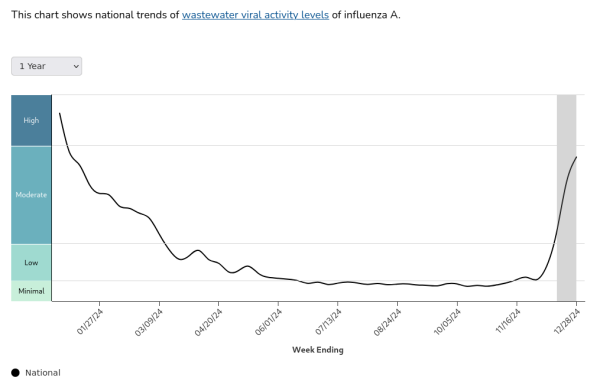
https://www.cdc.gov/nwss/rv/InfluenzaA-nationaltrend.html
I'll be asking my kids to wear a KN95 / KF94 mask daily for the next 3 weeks at school.
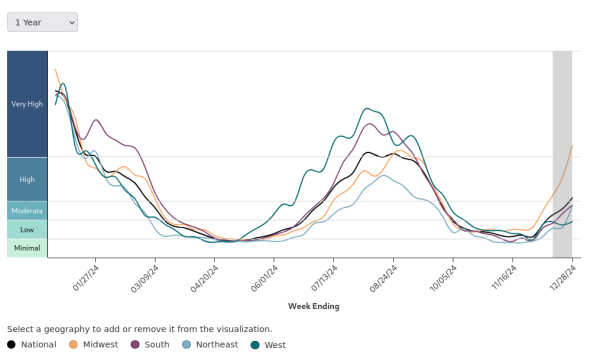
Wastewater COVID-19 National and Regional Trends
CDC’s National Wastewater Surveillance System, U.S. National trendsCenters for Disease Control and Prevention
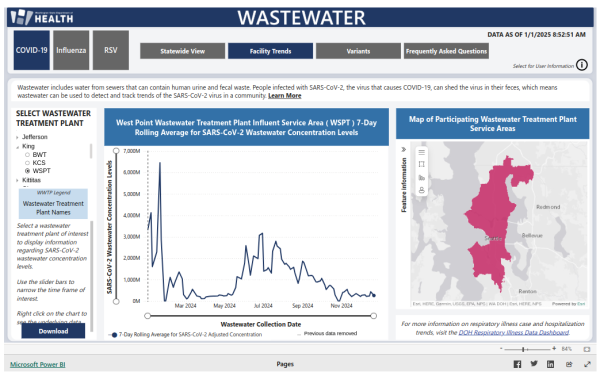
Let's start with the West Point (WSPT) sewage treatment plant: the Sars-CoV-2 7-day rolling average came back down to its recent fairly low numbers this week after a bump up last week. The last 7DRA number was calculated on 12/22.
WSPT is one of three King County(-ish) sewersheds in this dataset. You can find overviews, individual sewershed results, and a breakdown of variants for the state wastewater surveillance program, along with other metrics like case counts and hospitalizations for Covid-19 and other respiratory illnesses, at https://doh.wa.gov/data-and-statistical-reports/diseases-and-chronic-conditions/communicable-disease-surveillance-data/respiratory-illness-data-dashboard#WasteWater. If you go to the page and click "learn more" in the statewide view tab, you can find out lots of details about how these data are calculated and how to interpret them. The dashboard gets updated every Wednesday (generally).
Note: when the state switched over to new data providers in September, they also removed the previous historical data from the graphical interface. That's because the two providers used different methodologies that made direct comparisons difficult. Unfortunately, it also removed valuable context for interpreting the results. So, keep in mind we're just seeing what happened in September 2023 until now.
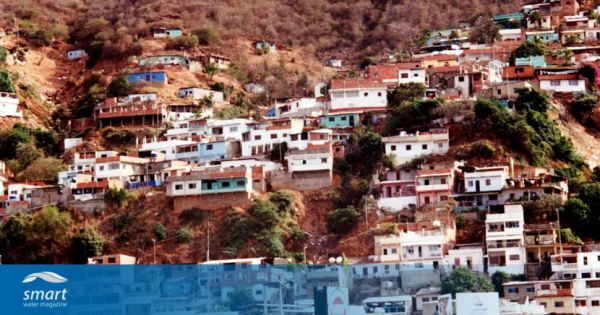
Barbados pioneers global first debt-for-climate-resilience operation
Barbados has successfully completed an unprecedented debt-for climate operation to finance water and sewage projects resilient to climate change. Throug...Inter-American Development Bank (IDB) (Smart Water Magazine)

