Suche
Beiträge, die mit RProgramming getaggt sind
Learn effective techniques to clean your data and enhance your analysis. Dive in now at https://www.spsanderson.com/steveondata/posts/2025-01-30/
#R #RStats #Programming #Stats #Data #RProgramming #Blog
` function in Base R, while the second method uses the `distinct()` function from the `dplyr` package. The editor window includes a gray background with red, yellow, and green buttons at the top, resembling a macOS terminal.")
How to Remove Duplicate Rows in R: A Complete Guide to Data Cleaning – Steve’s Data Tips and Tricks
Learn how to effectively remove duplicate rows in R using both Base R and dplyr methods. Complete guide with practical examples and best practices for data cleaning.Steve's Data Tips and Tricks
Check it out: https://www.spsanderson.com/steveondata/posts/2025-01-16/ and tell me which method you prefer!
#R #RStats #Programming #RProgramming #Blog #Code
` function. The code defines columns `id` (integer), `timestamp` (date), `value` (double), and `category` (factor). Below the code, the output of the `str()` function is displayed, showing the structure of the empty tibble with 0 rows and 4 columns, each with its respective data type.")
Creating Empty Data Frames in R: A Comprehensive Guide – Steve’s Data Tips and Tricks
Learn how to create empty data frames in R using base R, dplyr, and data.table methods. Complete guide with practical examples and best practices for R programmers.Steve's Data Tips and Tricks
Dive in at https://www.spsanderson.com/steveondata/posts/2025-01-09/ and let me know your experiences!
#R #RStats #Programming #Learn #Code #RProgramming #Blog #Matrix #Matricies #Array
. The second example creates a 2x2 matrix using matrix(NA, 2, 2). Both matrices are printed afterward.")

How to Create an Empty Matrix in R: A Comprehensive Guide – Steve’s Data Tips and Tricks
Discover the essential techniques to create and manipulate empty matrices in R. Master matrix initialization, filling, and best practices for efficient data handling.Steve's Data Tips and Tricks
Check it out at https://www.spsanderson.com/steveondata/posts/2025-01-09/ and share your thoughts!
Let's tackle those matrix challenges together!
#R #RStats #Programming #Data #Stats #RProgramming #Blog #Matrix #Matrices #Array
. The second example creates a 2x2 matrix using matrix(NA, 2, 2). Both matrices are printed afterward.")

How to Create an Empty Matrix in R: A Comprehensive Guide – Steve’s Data Tips and Tricks
Discover the essential techniques to create and manipulate empty matrices in R. Master matrix initialization, filling, and best practices for efficient data handling.Steve's Data Tips and Tricks
Learn how to clean them up with R's complete.cases()! This guide shows you how to handle missing data effectively with clear examples and tips. 🖥️💡
👉 https://www.spsanderson.com/steveondata/posts/2024-12-19/
#R #RStats #Programming #Data #Tips #RProgramming #blog
 and using `complete.cases(x)` to check which elements are non-missing, outputting `TRUE TRUE FALSE TRUE TRUE FALSE`.")
How to Use complete.cases in R With Examples – Steve’s Data Tips and Tricks
Learn how to effectively use complete.cases in R with practical examples. Master handling missing values, data cleaning, and advanced applications for better data analysis.Steve's Data Tips and Tricks
😱 Discover how R's complete.cases() can help you filter out incomplete rows and keep your analysis on track. Includes practical examples you can try today! 🧼✨
👉 https://www.spsanderson.com/steveondata/posts/2024-12-19/
#R #RStats #Programming #Clean #Data #Blog #BaseR #RProgramming
 and using `complete.cases(x)` to check which elements are non-missing, outputting `TRUE TRUE FALSE TRUE TRUE FALSE`.")
How to Use complete.cases in R With Examples – Steve’s Data Tips and Tricks
Learn how to effectively use complete.cases in R with practical examples. Master handling missing values, data cleaning, and advanced applications for better data analysis.Steve's Data Tips and Tricks
👉 Read the full guide: https://www.spsanderson.com/steveondata/posts/2024-12-05/
#R #RStats #Programming #DataAnalysis #NAvalues #Blog #RProgramming #Data
)` and stores the result in the variable `all_na_cols`, which is then printed. The code highlights R functions and syntax in different colors.")
How to Find Columns with All Missing Values in Base R – Steve’s Data Tips and Tricks
Find out how to easily identify columns in your R data frame that contain only missing (NA) values using base R functions. Streamline your data cleaning process with these simple techniques.Steve's Data Tips and Tricks
📖
Dive in here: https://www.spsanderson.com/steveondata/posts/2024-12-02/
#R #RStats #Programming #DataScience #Coding #Blog #RProgramming
 in a vector in R. The code defines a vector v with values c(10, NA, 20, 30, NA, 50). It calculates the mean of the non-missing values using mean(v, na.rm = TRUE) and assigns it to mean_v. Then, it replaces the NA values in v with mean_v. The updated vector v is printed at the end. The editor window features a gray background with red, yellow, and green buttons in the top-left corner.")
How to Replace Missing Values in R: A Comprehensive Guide – Steve’s Data Tips and Tricks
Struggling with missing values in your R datasets? This in-depth guide covers proven techniques to effectively handle and replace NA values in vectors, data frames, and columns. Learn to use mean, median, and other methods for imputation.Steve's Data Tips and Tricks
📖
Read more: https://www.spsanderson.com/steveondata/posts/2024-12-02/
#R #RStats #Programming #Data #Tips #Blog #RProgramming
 in a vector in R. The code defines a vector v with values c(10, NA, 20, 30, NA, 50). It calculates the mean of the non-missing values using mean(v, na.rm = TRUE) and assigns it to mean_v. Then, it replaces the NA values in v with mean_v. The updated vector v is printed at the end. The editor window features a gray background with red, yellow, and green buttons in the top-left corner.")
How to Replace Missing Values in R: A Comprehensive Guide – Steve’s Data Tips and Tricks
Struggling with missing values in your R datasets? This in-depth guide covers proven techniques to effectively handle and replace NA values in vectors, data frames, and columns. Learn to use mean, median, and other methods for imputation.Steve's Data Tips and Tricks
Explore the full article here: https://www.spsanderson.com/steveondata/posts/2024-11-26/
#R #RStats #Programming #DataScience #Learn #Blog #select #subset #RProgramming #Coding #CodingTips
 function to remove columns B and D.")
Deleting Multiple Columns in R: A Step-by-Step Guide for Data Frame Manipulation – Steve’s Data Tips and Tricks
Learn how to efficiently remove multiple columns from a data frame in Base R using various methods like subset(), select(), the minus sign, and assigning NULL. Includes step-by-step examples for each approach.Steve's Data Tips and Tricks
Read more and comment your experiences! https://www.spsanderson.com/steveondata/posts/2024-11-25/
#R #RStats #Programming #Code #Learn #Blog #RProgramming #strings #stringr #stringi
 and checks if they are equal. If they are, it prints \"The strings are equal (case-insensitive).\" Otherwise, it prints \"The strings are not equal.\" The code is displayed in a dark-themed code editor.")
Mastering String Comparison in R: 3 Essential Examples and Bonus Tips – Steve’s Data Tips and Tricks
Learn how to compare strings in R with 3 practical examples. Discover techniques to compare two strings, compare vectors of strings, and find similarities between string vectors. Boost your R programming skills now!Steve's Data Tips and Tricks
Read more and share your thoughts: https://www.spsanderson.com/steveondata/posts/2024-07-01/index.html
#R #RStats #Programming #Data #Health #Blog #RProgramming
Unlocking the Power of Administrative Data with healthyR.data – Steve’s Data Tips and Tricks
Steve’s Data Tips and Tricks in R, C, SQL and LinuxSteve's Data Tips and Tricks
#R #RStats #Programming #DataScience #Tips #RProgramming #blog
https://www.spsanderson.com/steveondata/posts/2024-11-21/


How to Compare Two Columns in R: A Comprehensive Guide with Examples – Steve’s Data Tips and Tricks
Learn how to effectively compare two columns in R using various base R functions and techniques. Includes practical examples for R programmers.Steve's Data Tips and Tricks
#R #RStats #Programming #Data #Code #RProgramming #Blog
https://www.spsanderson.com/steveondata/posts/2024-11-21/


How to Compare Two Columns in R: A Comprehensive Guide with Examples – Steve’s Data Tips and Tricks
Learn how to effectively compare two columns in R using various base R functions and techniques. Includes practical examples for R programmers.Steve's Data Tips and Tricks
Experiment with these methods and share your insights in the comments!
#R #RStats #Programming #Innovation #Explore #RProgramming #vector #DataFrames #blog
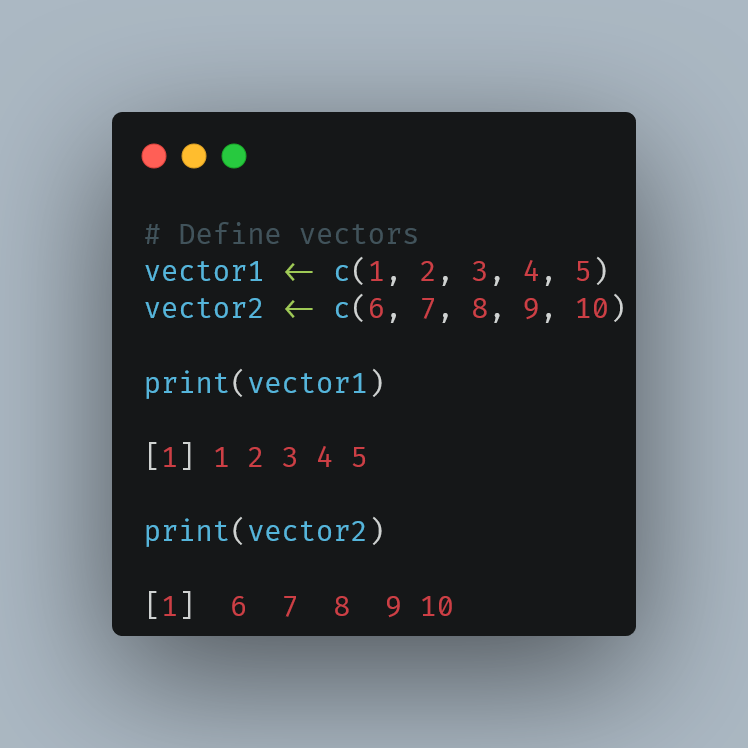
How to Combine Vectors in R: A Comprehensive Guide with Examples – Steve’s Data Tips and Tricks
Learn how to efficiently combine two or more vectors in R using base functions like c(), rbind(), cbind(), and data.frame(). Includes practical examples for R programmers.Steve's Data Tips and Tricks
Dive in now: https://www.spsanderson.com/steveondata/posts/2024-11-06/
#R #RStats #Programming #DataScience #Code #RProgramming #blog
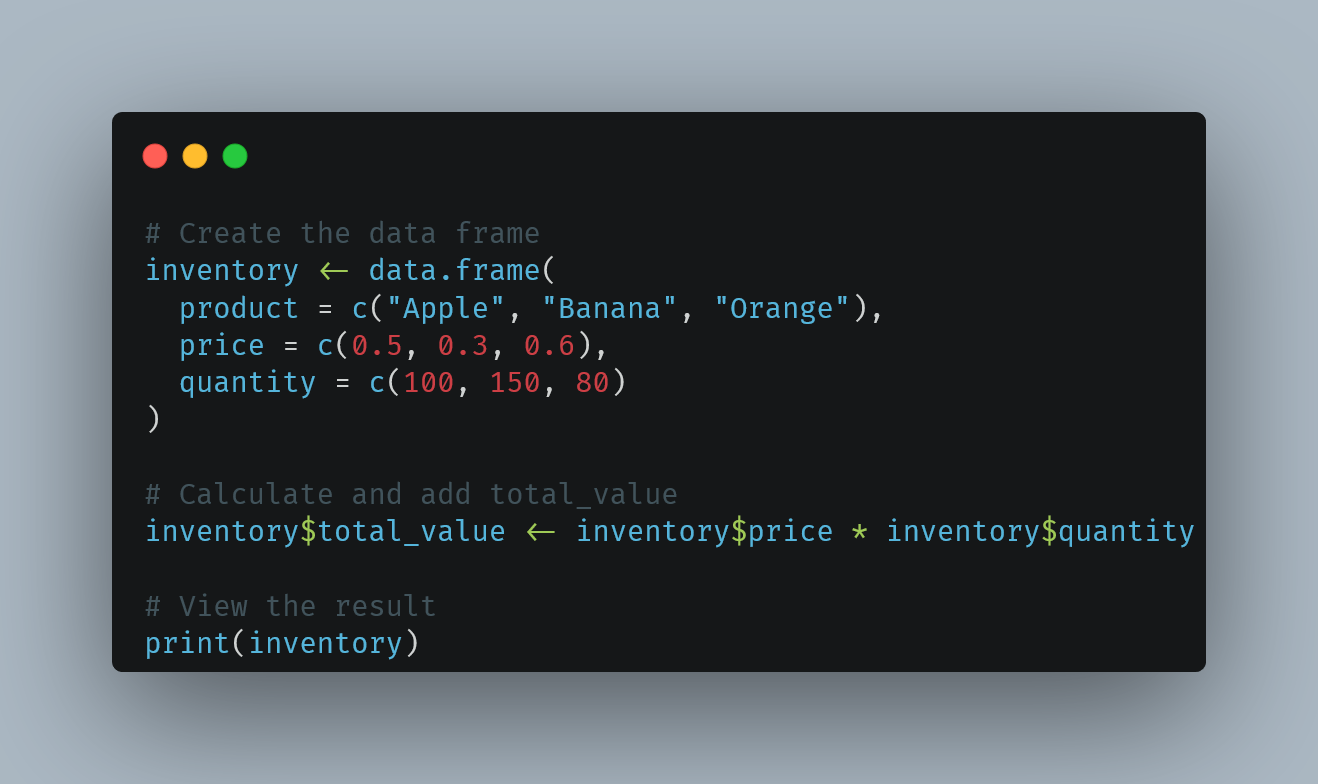

How to Use Dollar Sign ($) Operator in R: A Comprehensive Guide for Beginners – Steve's Data Tips and Tricks
Learn how to effectively use the dollar sign ($) operator in R programming to access data frame columns and list elements. Perfect guide for R beginners with practical examples.Steve's Data Tips and Tricks
Read more: https://www.spsanderson.com/steveondata/posts/2024-11-05/
#R #RStats #Programming #Data #LearnR #RProgramming #setdiff #blog
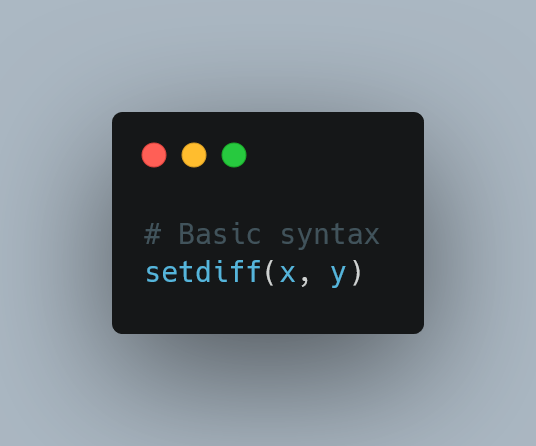

The Complete Guide to Using setdiff() in R: Examples and Best Practices – Steve’s Data Tips and Tricks
Learn how to effectively use the setdiff function in R with practical examples. Master vector comparisons, understand set operations, and solve real-world programming challenges.Steve's Data Tips and Tricks
My guide breaks it down with easy-to-follow examples.
Read and comment! 📈🔗 https://www.spsanderson.com/steveondata/posts/2024-11-04/
#R #RStats #Programming #Learn #Tips #RProgramming #blog
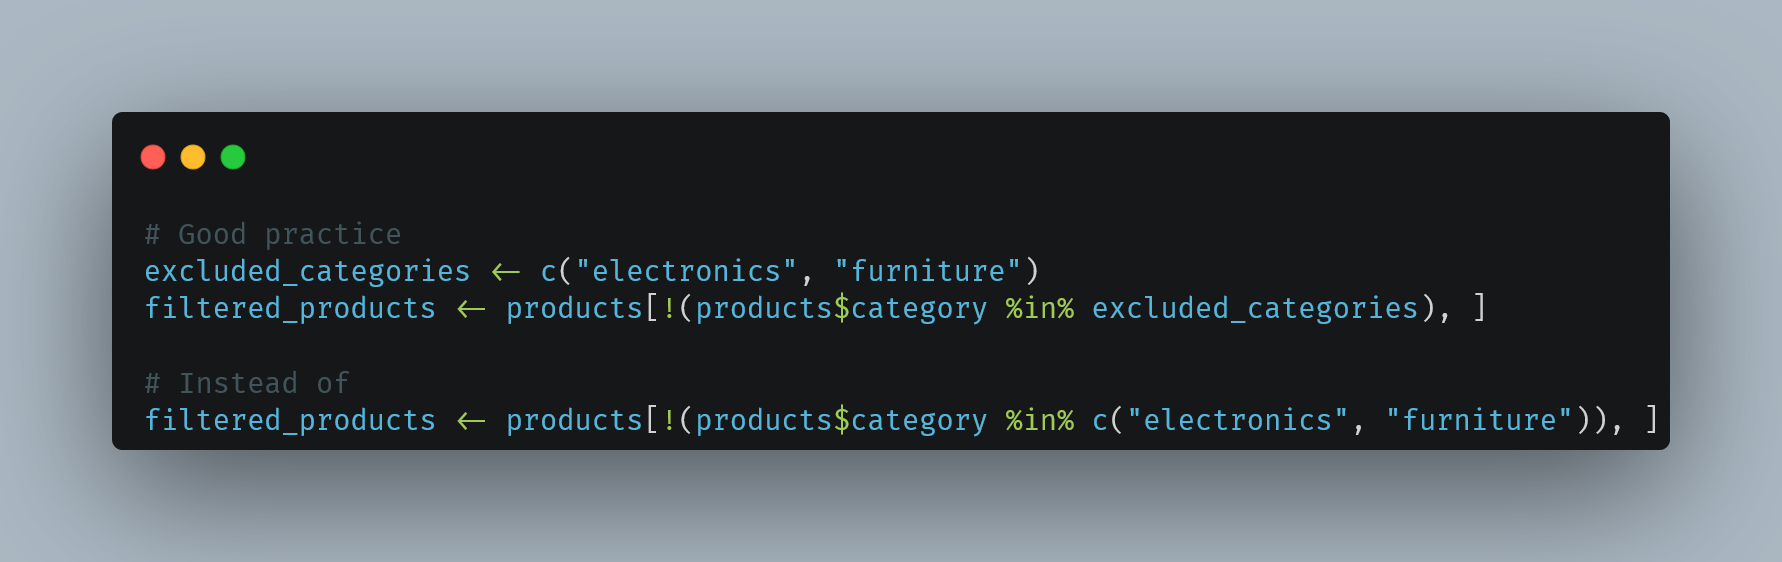

How to Use NOT IN Operator in R: A Complete Guide with Examples – Steve’s Data Tips and Tricks
Unlock the power of the NOT IN operator in R with this comprehensive guide. Learn syntax, practical examples, and advanced techniques to master data filtering, vector comparisons, and custom operator creation for better R programming.Steve's Data Tips and Tricks