Zum Inhalt der Seite gehen

Suche

Beiträge, die mit SeaIce getaggt sind


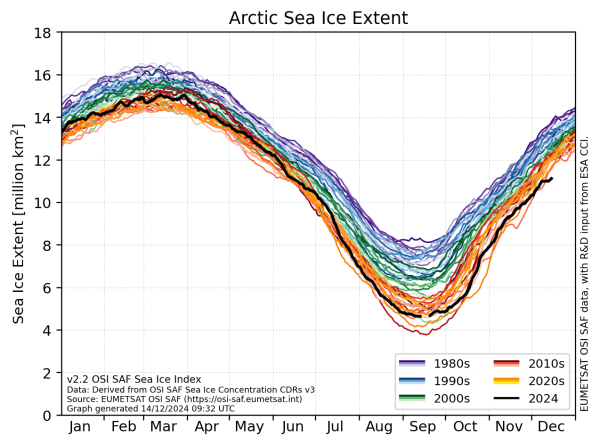
There is now less #SeaIce in the #Arctic than we ever recorded in mid December.

And we measure since the 1970s.

#climateChange @osi_saf @CopernicusECMWF
Curves of sea-ice area (in millions sq km) over time. The different colours are for the different years after 1978. The black curve is for 2024.


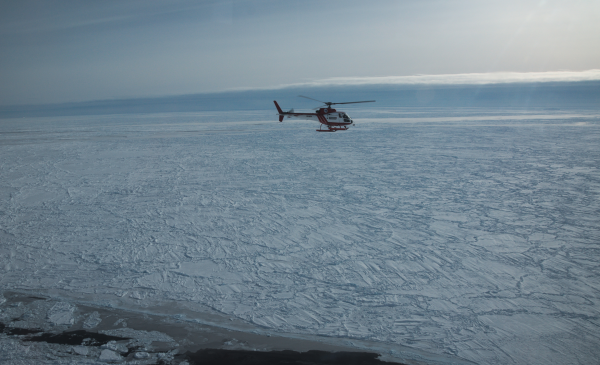
For a while in my life I did a good bit of this. It is quite an incredible place, and all this freezes and melts in Earth's second largest seasonal cycle...

...yet we still know so little about it...

#seaice #lidar #climate #calval #Antarctica
A helicopter flying over vast fields of sea ice off East Antarctica


every now and then, I look at this graph, and think about how, for decades, from 1979 until the boreal fall, or austral spring, of 2016, antarctic sea ice just seemed to ignore global warming, showing no trend. Then, suddenly, as the end of 2016 and the southern hemisphere summer approached, *clunk* antarctic sea ice fell down, and did not get up.

graph by @ZLabe , from https://zacklabe.com/antarctic-sea-ice-extentconcentration/

#ice
#globalWarming
#seaIce
#Antarctic
#AntarcticSeaIce
#climate
Graph of antarctic sea ice anomalies, from 1979 to 2024. It varies in a jagged and highly irregular fashion, with vertical excursions as high as positive 2.5 million square kilometres, and as low as negative 2.5 million square kilometres, but from 1979 to late 2016, there is little to no trend. Then, in late 2016, there is a sharp step-change, a near-vertical drop of around 2.5 million square kilometres. Then the line resumes its prior highly jagged, seemingly trendless behavior, but about 1.5 million square kilometres lower than before.