Sunday morning.
This map always shows NOAA’s “Fire Weather Outlooks” for the following day. At the time of my post, that would be Monday.
There are three levels based on forecasts for wind and humidity. NOAA designates those levels as Elevated, Critical and Extreme. On this map the area classified as Extreme is purple.
#LAfires #SantaAnna #CAfire #CAwx #Wildfire
Open GISsurfer map:
https://mappingsupport.com/p2/gissurfer.php?center=34.172874,-118.317394&zoom=8&basemap=USA_basemap&overlay=State_boundary,County_boundary,Lake_river_stream,USA_roads,Fire_weather_day_2&data=https://mappingsupport.com/p2/special_maps/disaster/USA_wildland_fire.txt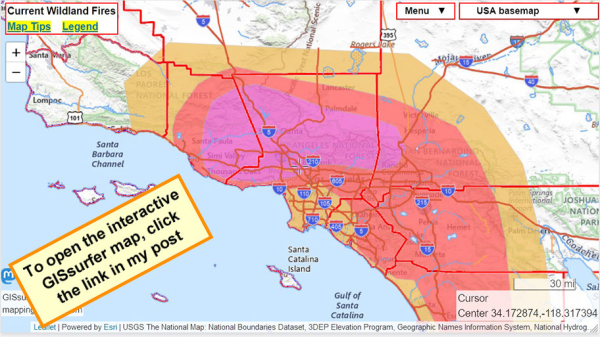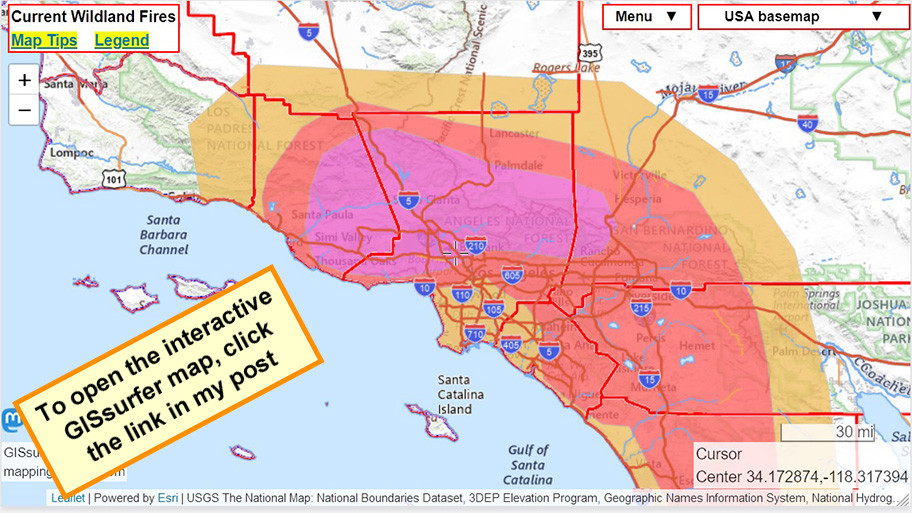
GISsurfer General Purpose Web Map and GIS Viewer | Surf GIS DATA
GISsurfer lets you surf a nearly endless amount of GIS data. Click a layer in the GIS server's table of contents and that data appears on the map.mappingsupport.com
