Suche
Beiträge, die mit RStats getaggt sind
👉 How to Return Value from a Function in R: https://www.spsanderson.com/steveondata/posts/2025-04-21/
#Rstats #Rprog #Data #Code #Learn #Tips #Blog #Function #Return #Programming
How to Return Value from a Function in R: A Complete Guide – Steve’s Data Tips and Tricks
Learn how to return values from functions in R with practical examples. Explore implicit returns, the return() function, and techniques for returning multiple values in simple, easy-to-follow code. Perfect for R programmers of all levels.Steve's Data Tips and Tricks
How to Write a Repeat Loop in R: Complete Guide with Practical Examples – Steve’s Data Tips and Tricks
Discover how to effectively use repeat loops in R programming with this comprehensive guide. Explore practical examples, best practices, and common pitfalls to enhance your coding skills.Steve's Data Tips and Tricks
🎯 Check it out: The Complete Guide to While Loops in R here: https://www.spsanderson.com/steveondata/posts/2025-03-31/
#R #RStats #Programming #Data #Code #Blog #RProgramming
The Complete Guide to While Loops in R – Steve’s Data Tips and Tricks
Discover the complete guide to while loops in R programming! Learn how to implement while loops with practical examples, avoid common pitfalls like infinite loops, and explore comparisons with for loops.Steve's Data Tips and Tricks
Short version: I need to generate a PDF report about survey data (with some text and a plot for each survey item) but the number of items needs to be dynamic.
More details on this stackoverflow post: https://stackoverflow.com/questions/79544345/generating-a-report-with-a-dynamic-set-of-plots-and-corresponding-text-in-r
#Rstats #R

Generating a report with a dynamic set of plots and corresponding text in R?
I have to generate a report (ideally a PDF) about some survey data with a plot for each item. I'd prefer to use ggplot2 for the plots. The problem is, the reporting tool should be agnostic towards ...Stack Overflow
Discover how to create sparklines in Reactable tables within a Shiny app in our latest post by Data Scientist Osheen MacOscar.
#Rshiny #Rstats #Blogs
https://www.jumpingrivers.com/blog/sparkline-reactable-shiny/
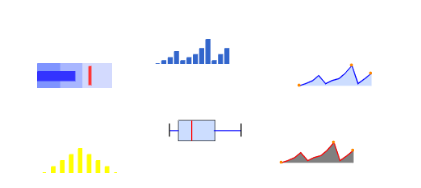
Sparklines in Reactable Tables in Shiny Apps
In this blog I will demonstrate how to use sparkline reactable tables in a Shiny app. Thankfully {reactable} has some helpful functions that make this super easy!www.jumpingrivers.com
Read more at https://www.spsanderson.com/steveondata/posts/2025-03-17/
#R #RStats #Programming #DataSci #LearnR #Blog #RPgramming #Loop
For-Loop with Range in R: A Complete Guide with Examples – Steve’s Data Tips and Tricks
Discover how to use for-loops with ranges in R with this comprehensive guide featuring clear examples, best practices, and interactive exercises for both beginners and experienced R programmers.Steve's Data Tips and Tricks
Explore the examples ➡️ https://www.spsanderson.com/steveondata/posts/2025-03-10/
#R #Data #Code #RProgramming #Programming #Loops #NestedLoops #Blog
How to Create a Nested For Loop in R: A Complete Guide – Steve’s Data Tips and Tricks
Master nested for loops in R with this comprehensive guide. Learn syntax, examples, and best practices for working with multi-dimensional data structures. Perfect for R programmers from beginner to advanced levels.Steve's Data Tips and Tricks
Here are powerful R techniques to handle missing data like a pro:
✨ tidyr::drop_na() for quick cleaning
🔄 dplyr::coalesce() for smart replacements
📊 mice package for imputation
🎯 Custom functions for complex cases
Check out the full guide! #R #RStats #DataCleaning #Tidy #Stats #Blog #RProgramming #Data
https://www.spsanderson.com/steveondata/posts/2025-03-03/
The Complete Guide to Handling NA Values in R Tables: Methods, Best Practices, and Solutions – Steve’s Data Tips and Tricks
Learn comprehensive methods for handling NA values in R tables, including best practices, code examples, and solutions. Master data preprocessing with practical tips and avoid common pitfalls.Steve's Data Tips and Tricks
My latest article covers it all! Learn how to choose the right method for your data needs.
Read it here: https://www.spsanderson.com/steveondata/posts/2025-02-24/ and let me know what you think!
#R #RStats #Programming #table #data #Blog #dplyr #datatable
How to Create Tables in R (With Examples) – A Comprehensive Guide Using Base R, dplyr, and data.table – Steve’s Data Tips and Tricks
Master table creation in R using Base R, dplyr, and data.table with practical examples. Learn efficient data summarization techniques for R programmers of all levels.Steve's Data Tips and Tricks
Discover practical techniques in "How to Replace Values in Data Frame Based on Lookup Table in R" at https://www.spsanderson.com/steveondata/posts/2025-02-17/
Join the conversation and share your experiences!
#R #RStats #Programming #Stats #Data #Blog
How to Replace Values in Data Frame Based on Lookup Table in R – Steve’s Data Tips and Tricks
Learn how to efficiently replace values in R data frames using lookup tables. Comprehensive guide covering basic to advanced techniques, optimization, and best practices.Steve's Data Tips and Tricks
Check it out at https://www.spsanderson.com/steveondata/posts/2025-02-10/ and share your experiences!
#R #RStats #Programming #Learn #Code #Blog
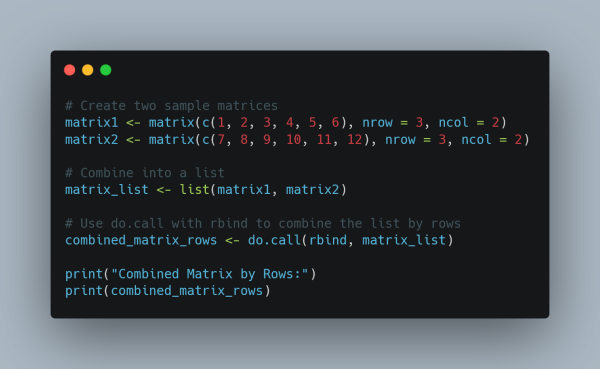
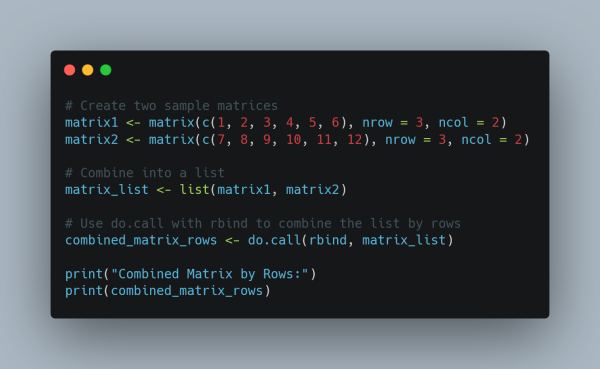
How to Combine a List of Matrices in R: A Comprehensive Guide – Steve’s Data Tips and Tricks
Learn how to combine a list of matrices in R using base R functions like rbind() and cbind(). This comprehensive guide is tailored for R programmers with clear examples for combining matrices by rows and by columns.Steve's Data Tips and Tricks
Pls. boost so this can be seen by folks who might have a use for it 🙏
https://github.com/lisawilliams/NIH_Data
GitHub - lisawilliams/NIH_Data: A repository with pointers to NIH project data from NIH RePorter from 2019-2024
A repository with pointers to NIH project data from NIH RePorter from 2019-2024 - lisawilliams/NIH_DataGitHub
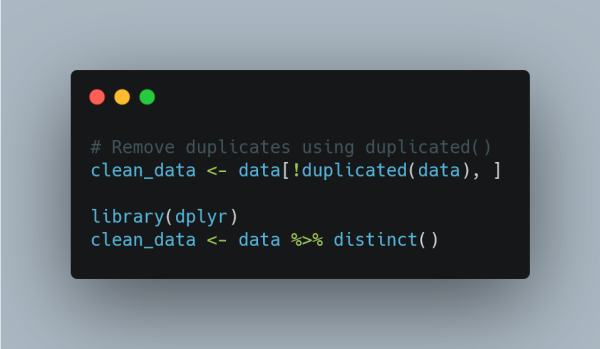
Learn effective techniques to clean your data and enhance your analysis. Dive in now at https://www.spsanderson.com/steveondata/posts/2025-01-30/
#R #RStats #Programming #Stats #Data #RProgramming #Blog
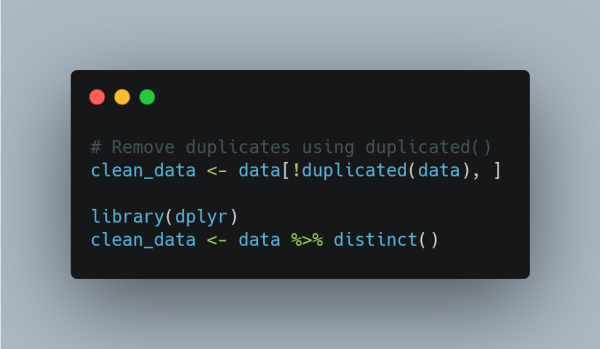
How to Remove Duplicate Rows in R: A Complete Guide to Data Cleaning – Steve’s Data Tips and Tricks
Learn how to effectively remove duplicate rows in R using both Base R and dplyr methods. Complete guide with practical examples and best practices for data cleaning.Steve's Data Tips and Tricks
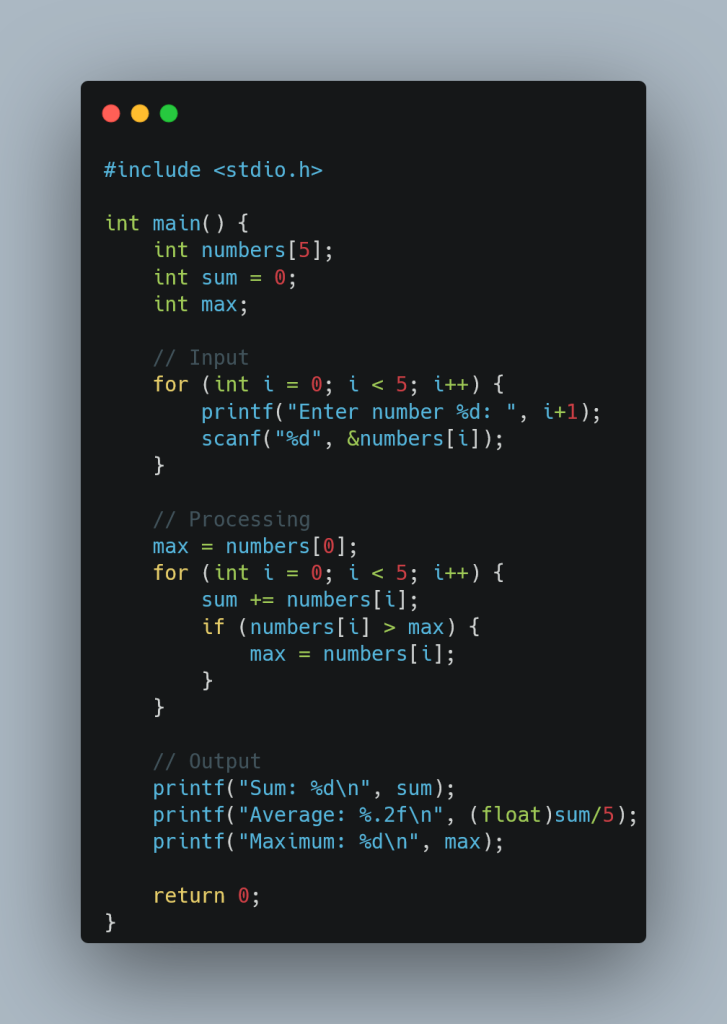
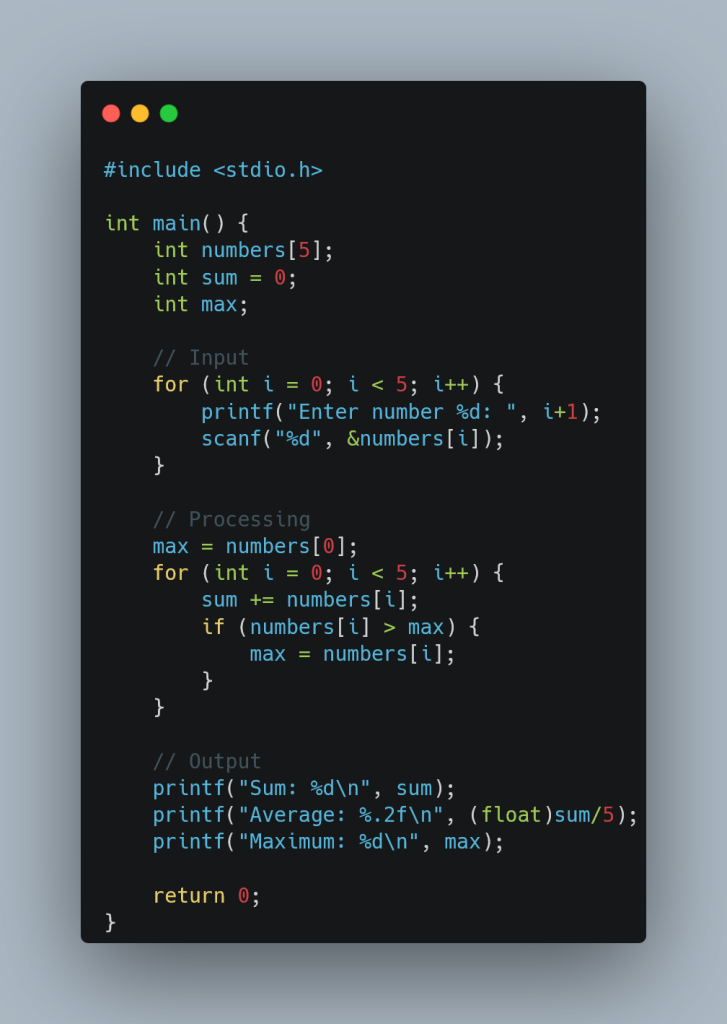
Check it out and share your feedback! https://www.spsanderson.com/steveondata/posts/2025-01-29/
#C #CProgramming #RStats #blog #Coding #Programming
A Complete Beginner’s Guide to Dealing with Arrays in C Programming – Steve’s Data Tips and Tricks
Master C programming arrays with our comprehensive guide. Learn array declaration, initialization, and manipulation with practical examples perfect for beginner programmers.Steve's Data Tips and Tricks
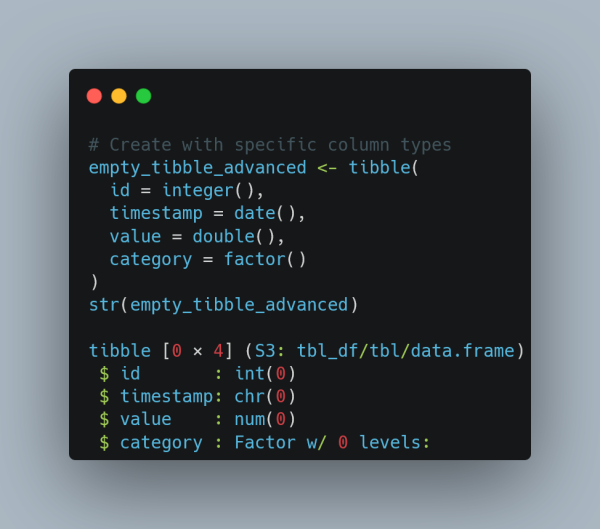
Check it out: https://www.spsanderson.com/steveondata/posts/2025-01-16/ and tell me which method you prefer!
#R #RStats #Programming #RProgramming #Blog #Code
Creating Empty Data Frames in R: A Comprehensive Guide – Steve’s Data Tips and Tricks
Learn how to create empty data frames in R using base R, dplyr, and data.table methods. Complete guide with practical examples and best practices for R programmers.Steve's Data Tips and Tricks
Check it out at https://www.spsanderson.com/steveondata/posts/2025-01-13/ and share your insights in the comments!
#R #RStats #Programming #Data #Tech #Blog
How to Create an Empty List in R: A Comprehensive Guide with Examples – Steve’s Data Tips and Tricks
Learn multiple methods to create and work with empty lists in R programming. Includes practical examples, best practices, and common use cases for efficient list manipulation.Steve's Data Tips and Tricks
Check it out at https://www.spsanderson.com/steveondata/posts/2025-01-13/! Your thoughts matter, so feel free to comment!
#R #RStats #Programming #Data #Code #Blog
How to Create an Empty List in R: A Comprehensive Guide with Examples – Steve’s Data Tips and Tricks
Learn multiple methods to create and work with empty lists in R programming. Includes practical examples, best practices, and common use cases for efficient list manipulation.Steve's Data Tips and Tricks
Dive in at https://www.spsanderson.com/steveondata/posts/2025-01-09/ and let me know your experiences!
#R #RStats #Programming #Learn #Code #RProgramming #Blog #Matrix #Matricies #Array
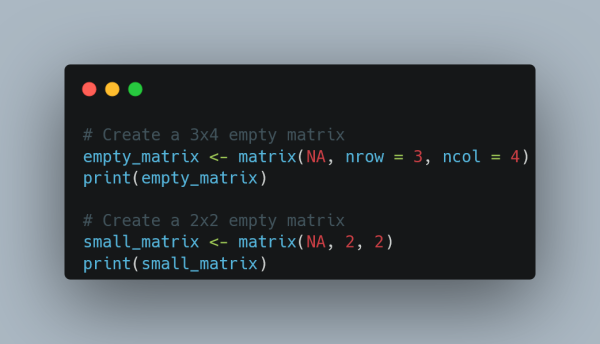
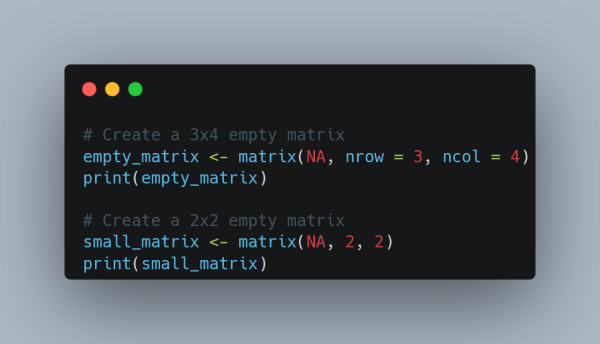
How to Create an Empty Matrix in R: A Comprehensive Guide – Steve’s Data Tips and Tricks
Discover the essential techniques to create and manipulate empty matrices in R. Master matrix initialization, filling, and best practices for efficient data handling.Steve's Data Tips and Tricks
Check it out at https://www.spsanderson.com/steveondata/posts/2025-01-09/ and share your thoughts!
Let's tackle those matrix challenges together!
#R #RStats #Programming #Data #Stats #RProgramming #Blog #Matrix #Matrices #Array
How to Create an Empty Matrix in R: A Comprehensive Guide – Steve’s Data Tips and Tricks
Discover the essential techniques to create and manipulate empty matrices in R. Master matrix initialization, filling, and best practices for efficient data handling.Steve's Data Tips and Tricks
Check it out here: https://www.spsanderson.com/steveondata/posts/2024-12-31/ 💡
#R #RStats #Programming #Data #Tips #Blog
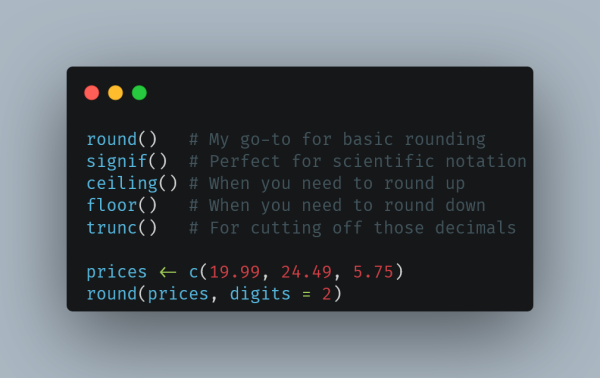
Rounding Numbers in R with Examples: A Comprehensive Guide – Steve’s Data Tips and Tricks
Master rounding numbers in R with this detailed guide. Learn how to use round(), signif(), ceiling(), floor(), and trunc() functions with practical examples.Steve's Data Tips and Tricks
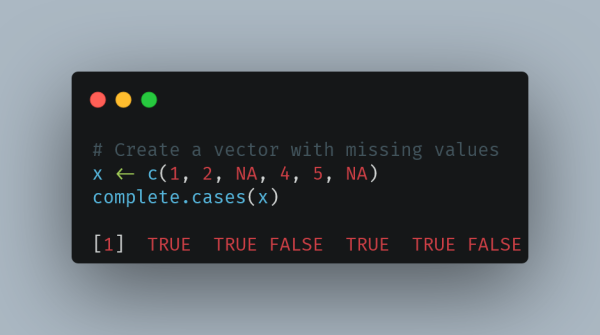
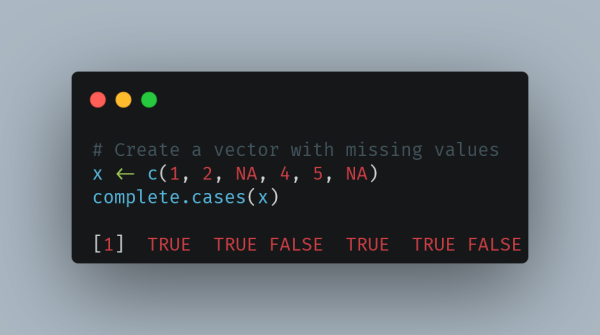
Learn how to clean them up with R's complete.cases()! This guide shows you how to handle missing data effectively with clear examples and tips. 🖥️💡
👉 https://www.spsanderson.com/steveondata/posts/2024-12-19/
#R #RStats #Programming #Data #Tips #RProgramming #blog
How to Use complete.cases in R With Examples – Steve’s Data Tips and Tricks
Learn how to effectively use complete.cases in R with practical examples. Master handling missing values, data cleaning, and advanced applications for better data analysis.Steve's Data Tips and Tricks
😱 Discover how R's complete.cases() can help you filter out incomplete rows and keep your analysis on track. Includes practical examples you can try today! 🧼✨
👉 https://www.spsanderson.com/steveondata/posts/2024-12-19/
#R #RStats #Programming #Clean #Data #Blog #BaseR #RProgramming
How to Use complete.cases in R With Examples – Steve’s Data Tips and Tricks
Learn how to effectively use complete.cases in R with practical examples. Master handling missing values, data cleaning, and advanced applications for better data analysis.Steve's Data Tips and Tricks
👉 https://www.spsanderson.com/steveondata/posts/2024-12-17/
#R #RStats #Programming #DataViz #Code #Blog
A Complete Guide to Using na.rm in R: Vector and Data Frame Examples – Steve’s Data Tips and Tricks
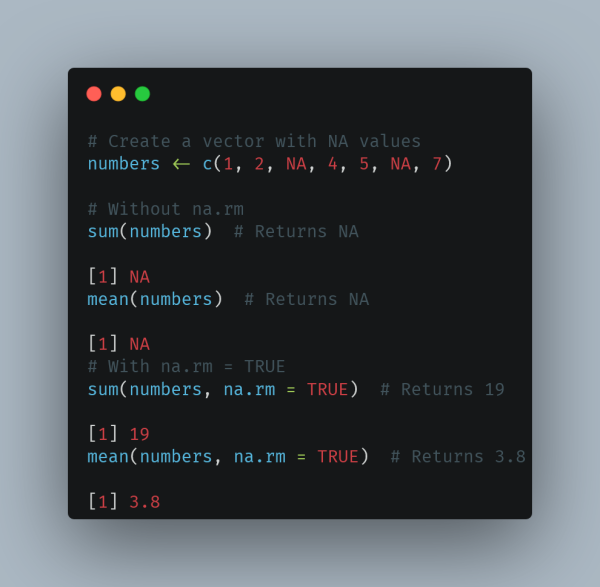
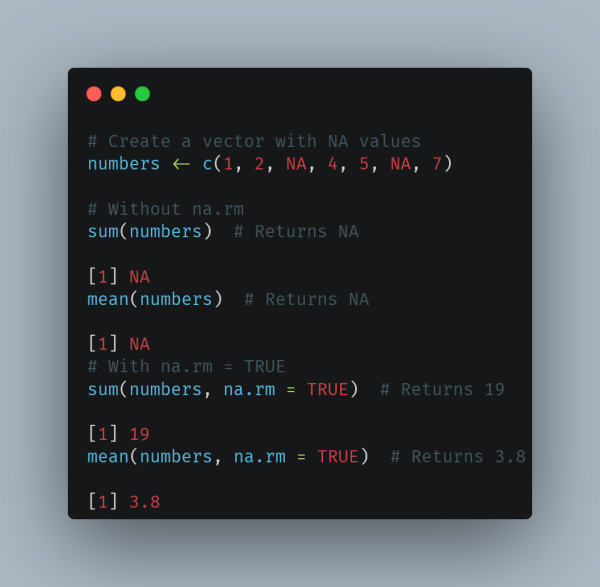
Master handling missing values in R with na.rm. Learn practical examples for vectors and data frames, plus best practices for effective data analysis.Steve's Data Tips and Tricks
👉 https://www.spsanderson.com/steveondata/posts/2024-12-17/
#R #RStats #Programming #Data #Tips #Blog
A Complete Guide to Using na.rm in R: Vector and Data Frame Examples – Steve’s Data Tips and Tricks
Master handling missing values in R with na.rm. Learn practical examples for vectors and data frames, plus best practices for effective data analysis.Steve's Data Tips and Tricks
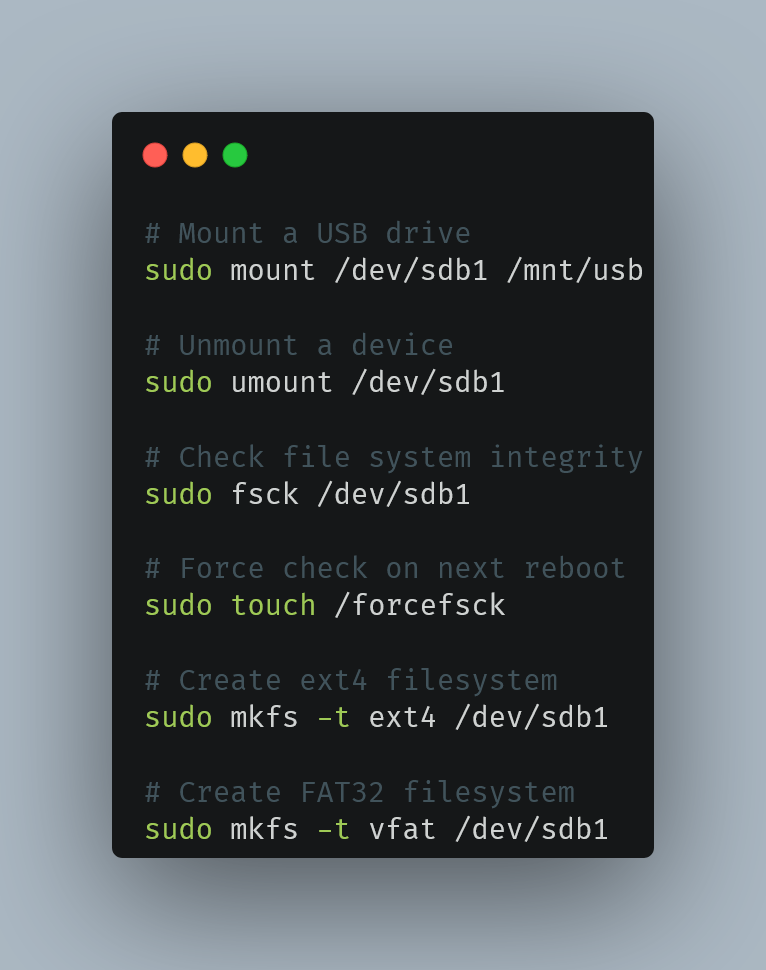
👉 Read here: https://www.spsanderson.com/steveondata/posts/2024-12-13/
#R #RStats #Programming #Linux #TechTips #Blog
Understanding Storage Media in Linux: A Beginner’s Guide – Steve’s Data Tips and Tricks
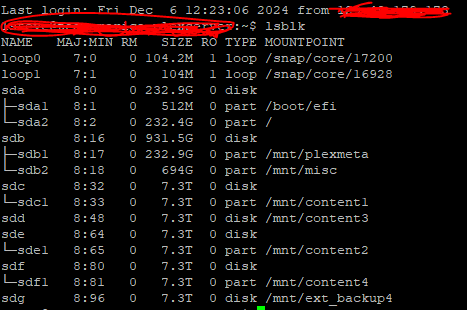
Comprehensive guide to Linux storage media management - from mounting devices and creating file systems to troubleshooting issues. Perfect for beginner Linux users.Steve's Data Tips and Tricks
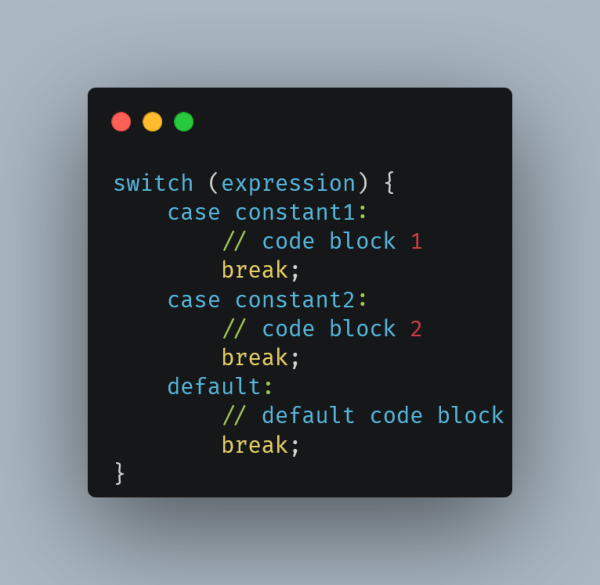
This guide covers:
✅ Syntax & structure
✅ Best practices
✅ Common mistakes to avoid
✅ Real-world examples Perfect for beginner C programmers! 🖥️
Take a look and share your thoughts: https://www.spsanderson.com/steveondata/posts/2024-12-11/
#R #RStats #Programming #C #CodeTips #Blog #CProgramming 🚀
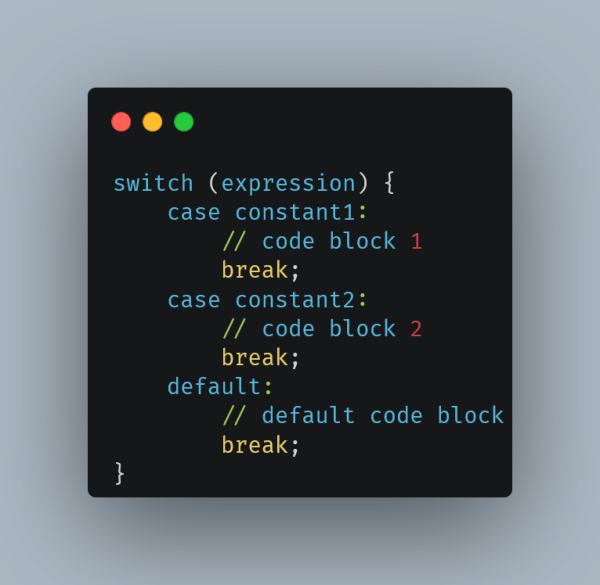
Understanding Switch Statements in C Programming – Steve’s Data Tips and Tricks
Mastering switch statements in C programming: Comprehensive guide with syntax, examples, best practices, and common pitfalls. Perfect for beginner C coders!Steve's Data Tips and Tricks
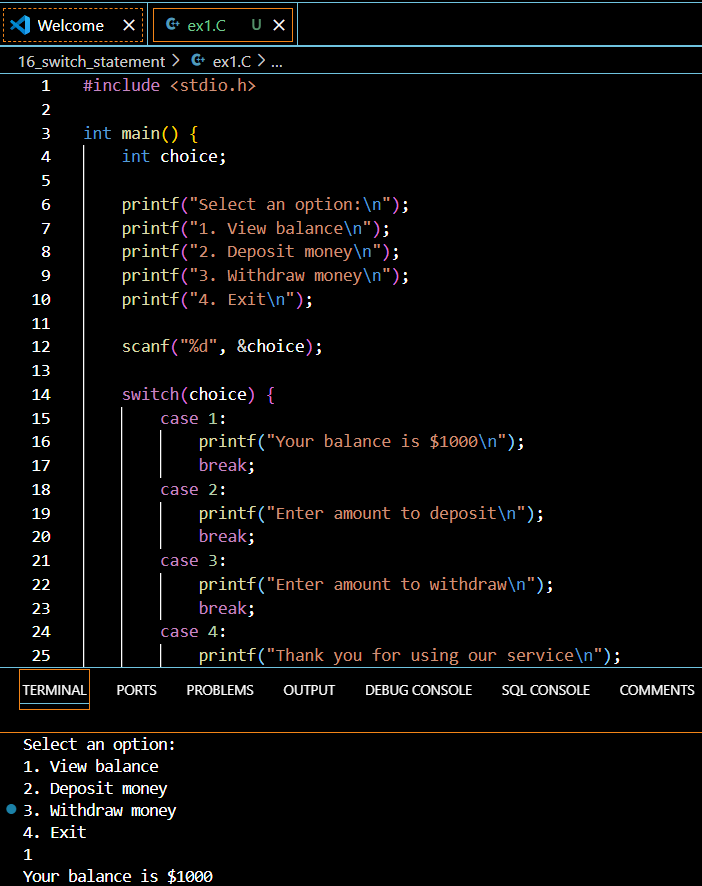
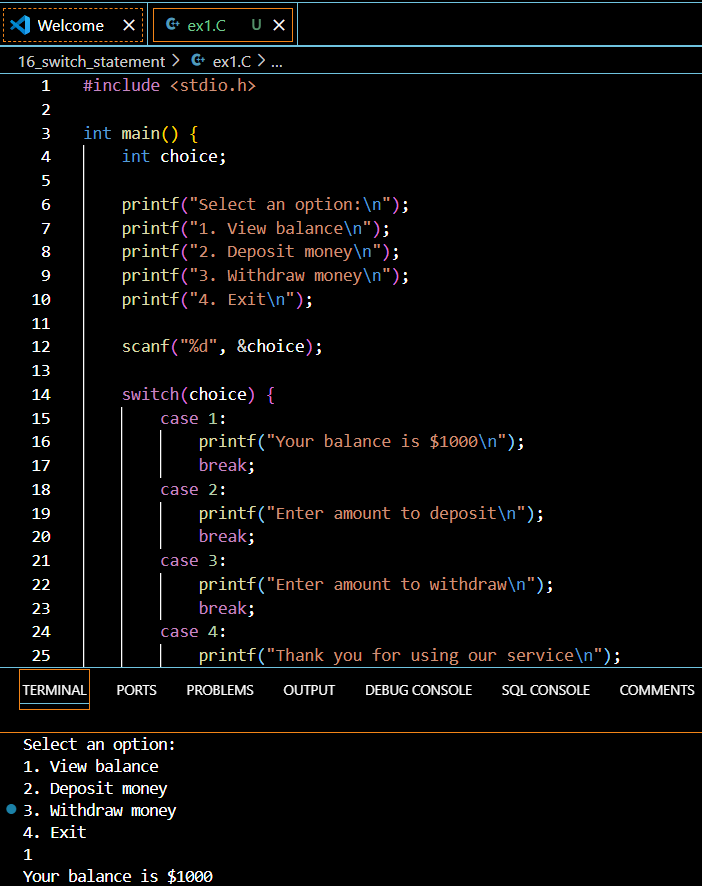
Switch statements are here to save the day! Learn how to simplify your code, avoid common mistakes, and write cleaner programs. 🛠️
Check out my beginner-friendly guide here: https://www.spsanderson.com/steveondata/posts/2024-12-11/
#R #RStats #Programming #C #Coding 💻#Blog
Understanding Switch Statements in C Programming – Steve’s Data Tips and Tricks
Mastering switch statements in C programming: Comprehensive guide with syntax, examples, best practices, and common pitfalls. Perfect for beginner C coders!Steve's Data Tips and Tricks
📚
Dive in here: https://www.spsanderson.com/steveondata/posts/2024-12-10/
#R #RStats #Programming #Data #LearnR #Blog
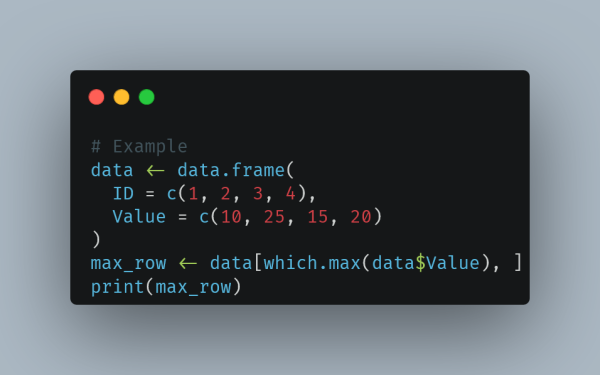
How to Select Row with Max Value in Specific Column in R: A Complete Guide – Steve’s Data Tips and Tricks
Discover three powerful methods to select rows with maximum values in R: base R’s which.max(), traditional subsetting, and dplyr’s slice_max(). Comprehensive guide with examples, best practices, and performance considerations.Steve's Data Tips and Tricks
Read & comment here: https://www.spsanderson.com/steveondata/posts/2024-12-10/
#R #RStats #Programming #DataScience #Tips #Blog
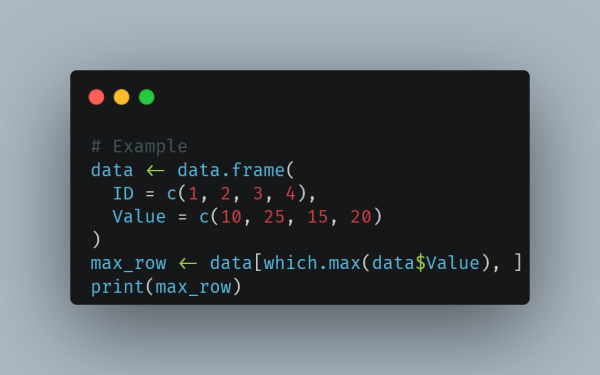
How to Select Row with Max Value in Specific Column in R: A Complete Guide – Steve’s Data Tips and Tricks
Discover three powerful methods to select rows with maximum values in R: base R’s which.max(), traditional subsetting, and dplyr’s slice_max(). Comprehensive guide with examples, best practices, and performance considerations.Steve's Data Tips and Tricks


![# Inefficient approach (without pre-allocation)
result_inefficient <- c()
for (i in 1:1000) {
result_inefficient <- c(result_inefficient, i^2)
}
# Efficient approach (with pre-allocation)
result_efficient <- numeric(1000)
for (i in 1:1000) {
result_efficient[i] <- i^2
} # Inefficient approach (without pre-allocation)
result_inefficient <- c()
for (i in 1:1000) {
result_inefficient <- c(result_inefficient, i^2)
}
# Efficient approach (with pre-allocation)
result_efficient <- numeric(1000)
for (i in 1:1000) {
result_efficient[i] <- i^2
}](https://friendica-leipzig.de/photo/preview/600/742445)
![# Inefficient approach (without pre-allocation)
result_inefficient <- c()
for (i in 1:1000) {
result_inefficient <- c(result_inefficient, i^2)
}
# Efficient approach (with pre-allocation)
result_efficient <- numeric(1000)
for (i in 1:1000) {
result_efficient[i] <- i^2
} # Inefficient approach (without pre-allocation)
result_inefficient <- c()
for (i in 1:1000) {
result_inefficient <- c(result_inefficient, i^2)
}
# Efficient approach (with pre-allocation)
result_efficient <- numeric(1000)
for (i in 1:1000) {
result_efficient[i] <- i^2
}](https://friendica-leipzig.de/photo/preview/600/742441)


![A code snippet in R programming language displayed on a dark-themed editor. The code demonstrates creating a mixed-type list using the list() function. The list contains three elements: the number 1, the string "text", and the logical value TRUE. The output shows the list elements indexed as [[1]], [[2]], and [[3]], with their respective values displayed below each index. A code snippet in R programming language displayed on a dark-themed editor. The code demonstrates creating a mixed-type list using the list() function. The list contains three elements: the number 1, the string "text", and the logical value TRUE. The output shows the list elements indexed as [[1]], [[2]], and [[3]], with their respective values displayed below each index.](https://friendica-leipzig.de/photo/preview/600/427711)
![A code snippet in R programming language displayed on a dark-themed editor. The code demonstrates creating a mixed-type list using the list() function. The list contains three elements: the number 1, the string "text", and the logical value TRUE. The output shows the list elements indexed as [[1]], [[2]], and [[3]], with their respective values displayed below each index. A code snippet in R programming language displayed on a dark-themed editor. The code demonstrates creating a mixed-type list using the list() function. The list contains three elements: the number 1, the string "text", and the logical value TRUE. The output shows the list elements indexed as [[1]], [[2]], and [[3]], with their respective values displayed below each index.](https://friendica-leipzig.de/photo/preview/600/427701)
