Suche
Beiträge, die mit ARCTIC getaggt sind
But I would also like a little normalcy today on my feed, so here's my go-to sea ice data viz update. Though, to be clear, the info certainly isn't normal...
#Arctic sea ice extent still remains the *lowest* on record for the date (JAXA). Not good.


Data: NOAA OISSTv2.1 (https://www.ncei.noaa.gov/products/optimum-interpolation-sst) 🌊

Optimum Interpolation Sea Surface Temperature (OISST)
The NOAA 1/4° Daily Optimum Interpolation Sea Surface Temperature (OISST) is a long term Climate Data Record that incorporates observations from different platforms (satellites, ships, buoys and Argo floats) into a regular global grid.National Centers for Environmental Information (NCEI)
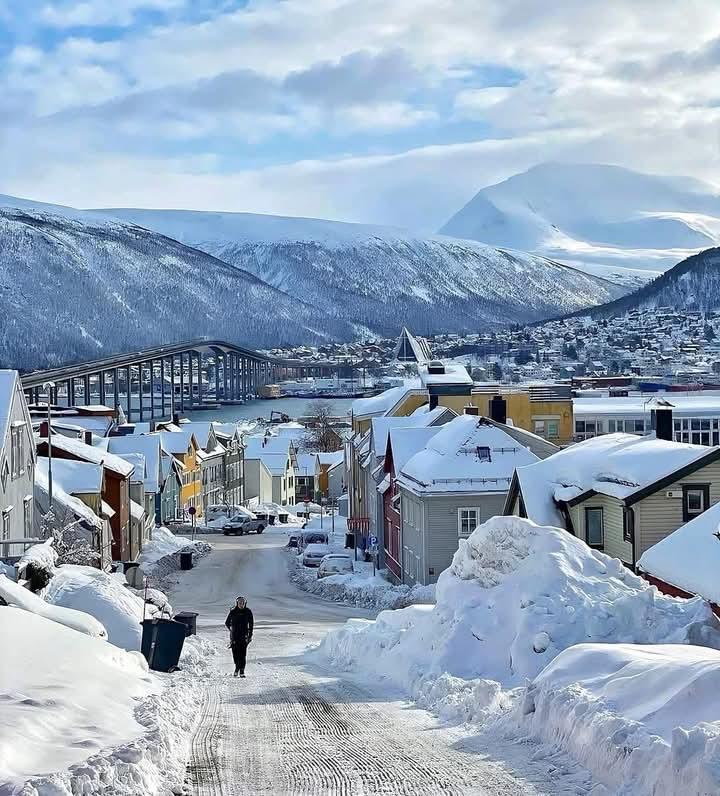
#tromso #norway #troms #travel #norge #auroraborealis #northernlights #nature #visittromso #visitnorway #nordnorge #northernnorway #ig #arctic #tromsolove #europe #travelpics #oslo #noruega #like #explore #travelphotography #fronteiras #norwaynature #photography #traveltheworld #aurora #scandinavia #naturephotography #mountains
.")
#HumanRights #Gaza #Genocide #FreePalestine #Arctic #NWT

Palestinian Solidarity North of 60 - rabble.ca
Even in the far-north, the voices calling for peace and justice for Palestinians are active and won't be silenced.Shannon Moore (rabble)
#Russia #Trussia #USA #Greenland #Canada #Arctic #geopolitics #expansion #dominion #world


Data from NOAA OISSTv2.1. For more info: https://doi.org/10.25923/9z96-aq19

Sea ice data from: https://nsidc.org/data/seaice_index. Map from https://climatereanalyzer.org/


• about 640,000 km² below the 2010s mean
• about 1,280,000 km² below the 2000s mean
• about 1,850,000 km² below the 1990s mean
• about 2,290,000 km² below the 1980s mean
Plots: https://zacklabe.com/arctic-sea-ice-extentconcentration/

Arctic: Sea-Ice Concentration/Extent
My visualizations: Arctic Climate Seasonality and Variability Arctic Sea Ice Extent and Concentration Arctic Sea Ice Volume and Thickness Arctic Temperatures Antarctic Sea Ice Extent and Concentrat…Zachary Labe
#SilentSunday #stillersonntag
#Fotografie #fotografia #foto #photo #photography #photographie #fotograaf #potd #alttext #travel #camelCase #abstract #travelphotography #photooftheday #norge #norway #arctic #honningsvåg
 Its Toe Area Worn And Cracked. Stuffed In The Top Is A Large Bunch Of Green And Purple Heather. Moving Away From The Camera Is Another Yellow Boot, Missing The Part Above The Ankle, Still Stuffed With Heather But With A Small Stick And Flag Coming Out Of The Top. Next A Green Boot, With Heather But No Flag Then Another Yellow Boot, Again With Heather And Flag. And So The Row Of Boots Continue (Ten Or More) In A Slightly Random Fashion All Resting On A Stout Grey Wooden Line Of Planks - Fading Out Of Focus Into The Distance.
The Location Is The Sjøgata Pub (Other Watering Holes Are Available - But Not Many) In Honningsvåg. 71º North Of The Equator, Very High In The Norwegian Arctic (2018)")
Navigation into Trollfjorden, N of Svolvaer, is unbelievable, given how tight it is - to navigate then turn (on the spot) to return. Impressive stuff from the skipper.
#Arctic #bloomscrolling


• about 610,000 km² below the 2010s mean
• about 2,160,000 km² below the 1980s mean
Additional long-term sea ice graphs: https://zacklabe.com/arctic-sea-ice-figures/

Polar Climate Change Figures
Near real-time visualizations Arctic Climate Seasonality and Variability Arctic Sea Ice Extent and Concentration Arctic Sea Ice Volume and Thickness Arctic Temperatures Antarctic Sea Ice Extent, Co…Zachary Labe
And we measure since the 1970s.
#climateChange @osi_saf @CopernicusECMWF
 over time. The different colours are for the different years after 1978. The black curve is for 2024.")
Drastic shift driven by frequent #wildfires, pushing surface air #temperatures to second-warmest on record since 1900
by Dharna Noor, Tue 10 December
"The Arctic tundra is undergoing a dramatic transformation, driven by frequent wildfires that are turning it into a net source of carbon dioxide emissions after millennia of acting as a carbon sink, the US National Oceanic and Atmospheric Administration (#Noaa) said on Tuesday.
"This drastic shift is detailed in Noaa’s 2024 Arctic Report Card, which revealed that annual surface air temperatures in the Arctic this year were the second-warmest on record since 1900.
“'Our observations now show that the Arctic tundra, which is experiencing warming and increased wildfire, is now emitting more carbon than it stores, which will worsen climate change impacts,' said Rick Spinrad, a Noaa administrator.
"The report, led by scientists from the Woodwell Climate Research Center in Falmouth, Massachusetts, found that the Arctic is warming faster than the global average for the 11th year in a row.
"Currently, it is warming at up to four times the global rate, the authors found.
"Climate warming has dual effects on the Arctic. While it stimulates plant productivity and growth, which remove carbon dioxide from the atmosphere, it also leads to increased surface air temperatures that cause permafrost to thaw.
"When permafrost thaws, carbon trapped in the frozen soil is decomposed by microbes and released into the atmosphere as carbon dioxide and methane, two potent greenhouse gases.
"'We need accurate, holistic and comprehensive knowledge of how climate changes will affect the amount of carbon the Arctic is taking up and storing, and how much it’s releasing back into the atmosphere, in order to effectively address this crisis,' said Dr Sue Natali, a scientist at the Woodwell Center who contributed to the research. 'This report represents a critical step toward quantifying these emissions at scale.'
"Human-caused climate change is also intensifying high-latitude wildfires, which have increased in burned area, intensity and associated carbon emissions.
"Wildfires not only combust vegetation and soil organic matter, releasing carbon into the atmosphere, but they also strip away insulating soil layers, accelerating long-term permafrost thaw and its associated carbon emissions.
"'In recent years, we’ve seen how increasing fire activity from climate change threatens both communities and the carbon stored in permafrost, but now we’re beginning to be able to measure the cumulative impact to the atmosphere, and it’s significant,' said Dr Brendan Rogers, Woodwell Climate scientist and report contributor."
https://www.theguardian.com/world/2024/dec/10/arctic-tundra-carbon-shift?utm_source=firefox-newtab-en-us
#GlobalWarming #GlobalBurning #2024ArcticReportCard #ArcticWarming #Tundra #PermafrostThaw #GreenhouseGases #Methane #Microbes #ClimateCrisis #ClimateChange
This was 1,590,000 km² below the 1981-2010 average. November ice extent is decreasing at about 4.76% per decade.
Data: https://nsidc.org/data/seaice_index

October 09, 2024
"Permafrost, the thick layer of perennially frozen ground that covers much of the Arctic, slows down the migration of Arctic rivers, according to a new Caltech study. River migration is a common process in which a river's path meanders over time due to erosion of the riverbanks. This rerouting, which can also occur in #SuddenFloods, poses a threat for many communities that live along and depend on rivers. The findings also have implications for how the Arctic region will be impacted by a warming climate as permafrost thaws over time.
"The research was conducted in the Caltech laboratory of Michael Lamb, professor of geology, and is described in a paper appearing in the journal Nature on October 9.
"Led by graduate student Emily Geyman, the study focused on the #KoyukukRiver, a large tributary of the #YukonRiver that winds for hundreds of miles through interior Alaska. There was debate within the scientific community about whether the frozen soil along the riverbanks serves to fortify the banks against erosion or to promote it.
"'Large rivers like the Yukon or the Amazon can move tens to hundreds of feet per year,' Geyman says. "Arctic rivers in particular differ from temperate rivers because they need to thaw the material of their banks before they can pick that material up and move it.'
"Due to #ClimateChange, permafrost is slowly thawing over decades. But a river can experience drastic natural changes within a single year, with flow conditions changing from very cold and fast in early spring to warm and slow a few months later. Geyman and her collaborators leveraged these major changes that take place within a single season to gain a glimpse into how the rivers will behave in response to climate change decades or centuries into the future.
"In spring, the Koyukuk River swells in volume from snowmelt, flowing with fast, cold water. For more temperate rivers, a fast flow means more erosion. But in the Arctic, the temperature of the water matters—cold water is unable to thaw the frozen banks in order to migrate.
"In the new study, Geyman and her collaborators used satellite imagery of the Koyukuk over the past several years and developed a technique to decode high-resolution changes from the images. The team hypothesized that if permafrost was slowing the river's migration, they should only see migration later in the summer when the river water has warmed up. Their hypothesis matched with the satellite data, suggesting that permafrost does, in fact, slow down river migration.
"Next, the team compared sections of the river that flow through permafrost with those that do not. The Koyukuk is special because it traverses a patchwork of both permafrost and unfrozen ground. The team traveled to the Arctic to map the erosion on various bends of the river and found that sections without permafrost migrated twice as fast as analogous riverbends through permafrost terrain.
"The research is part of a larger effort to understand the dynamics of rivers and how they transport carbon, nutrients, and other materials trapped in the soil.
"'River migration has implications for local communities and infrastructure, and also for the Arctic environment,' Lamb says. 'About 1,500 gigatons of #carbon are stored in the frozen permafrost—about twice as much carbon as in the atmosphere, for comparison. There is also #mercury frozen in the soil that could be liberated into rivers as permafrost thaws. We are, ultimately, trying to understand what happens to these elements in the context of river erosion.'
"The work was a collaboration with local Alaska #Native communities, in particular from the town of #Huslia."
Read more:
https://www.caltech.edu/about/news/permafrost-thaw-may-cause-arctic-river-erosion-to-speed-up
#GlobalWarming #PermafrostMelt #MercuryPoisoning #CarbonSinks #WaterIsLife #ClimateChange #Arctic #Alaska

Permafrost Thaw May Cause Arctic River Erosion to Speed Up
Caltech researchers show that widespread permafrost thaw may cause rivers in the Arctic to migrate faster.California Institute of Technology
By Angela Dewan, CNN
Published February 13, 2024
"Warmer air temperatures have driven #IceLoss, which has in turn raised land temperatures. That has caused the melting of #permafrost, a frozen layer just beneath the Earth’s surface and found in much of the #Arctic, and that melt releases planet-warming #CarbonDioxide and #methane, contributing to more #GlobalWarming. #PermafrostMelt is also causing #LandInstability, which could impact infrastructure and buildings.
"'We have seen signs that the loss of ice is triggering other reactions which will result in further loss of ice and further ‘greening’ of Greenland, where shrinking ice exposes bare rock that is then colonized by tundra and eventually shrub,' one of the report’s authors, Jonathan Carrivick, said in a press release. 'At the same time, water released from the melting ice is moving sediment and silt, and that eventually forms wetlands and fenlands.'
"The loss of ice is creating what’s known as a #FeedbackLoop. Snow and ice typically reflect the sun’s energy back into space, preventing excessive heating in parts of the Earth. But as ice disappears, those areas absorb more solar energy, raising land surface temperatures, which can cause further melt and other negative impacts.
"#IceMelt also increases the amount of water in lakes, where water absorbs more heat than snow, which increases land surface temperatures.
"Greenland has been warming at twice the global mean rate since the 1970s, and the study’s authors warn that more extreme temperatures in the future are likely.
"Greenland is the world’s biggest island and is mostly covered by ice and #glaciers. Around 57,000 people live in the country, which is an autonomous country within the Kingdom of Denmark. Much of the population is #indigenous and many people there rely on natural #ecosystems for their survival.
"Michael Grimes, the report’s lead author, said that the flow of sediments and nutrients into coastal waters was particularly problematic for #IndigenousCommunities that rely on fishing, as well as for hunters on other parts of the island.
"'These changes are critical, particularly for the indigenous populations whose traditional subsistence hunting practices rely on the stability of these delicate #ecosystems,' he said.
"'Moreover, the loss of ice mass in Greenland is a substantial contributor to #GlobalSeaLevelRise, a trend that poses significant challenges both now and in the future.'"
https://www.cnn.com/2024/02/13/climate/greenland-ice-loss-vegetation-climate-intl/index.html
(We Will Walk the Trail of our Ancestors)
Princess Daazhraii Johnson with Alisha Carlson (Gwich'in)
"A grandfather teaches his granddaughter, a young Gwich'in mother named Alisha, how reciprocity is embedded in all aspects of life. The northern lights warm the caribou; the caribou helps feed and sustain the community; the community honors the connections. Each element in nature is purposeful and related. In turn, these connections bring new meaning to Alisha and her wishes for her children and for all living beings."
Watch:
https://www.reciprocity.org/films/diiyeghan-naii-taii-treedaa
#DCEFF #IndigenousStorytellers #IndigenousFilms #ReciprocityProject #Reciprocity #IndigenousFilmMakers #IndigenousWisdom #Gwichin #Arctic #TananChatoh

Diiyeghan naii Taii Tr’eedaa
A Gwich’in grandfather teaches his granddaughter how reciprocity is embedded in our lives. The northern lights warm the caribou; they feed and sustain us;…Nia Tero
You can read more about this data set at https://carbonbrief.org/guest-post-piecing-together-arctic-sea-ice-history-1850

Guest post: Piecing together the Arctic’s sea ice history back to 1850 - Carbon Brief
Scientists have constructed a record of Arctic sea ice history going back to 1850 - from some rather unusual sources.Rosamund Pearce (Carbon Brief)
Simulated data from PIOMAS. For more information: https://doi.org/10.1175/JCLI-D-17-0436.1

+ Graphic available: https://zacklabe.com/arctic-sea-ice-volumethickness/
+ Data from: https://psc.apl.uw.edu/research/projects/arctic-sea-ice-volume-anomaly/data/
Arctic: Sea-Ice Thickness/Volume
My visualizations: Arctic Climate Seasonality and Variability Arctic Sea Ice Extent and Concentration Arctic Sea Ice Volume and Thickness Arctic Temperatures Antarctic Sea Ice Extent and Concentrat…Zachary Labe
Graphic: https://zacklabe.com/arctic-sea-ice-volumethickness/. Data from PIOMAS.

Arctic: Sea-Ice Thickness/Volume
My visualizations: Arctic Climate Seasonality and Variability Arctic Sea Ice Extent and Concentration Arctic Sea Ice Volume and Thickness Arctic Temperatures Antarctic Sea Ice Extent and Concentrat…Zachary Labe
If you see red, that means it's warming...
Data: @CopernicusECMWF ERA5. More info: https://doi.org/10.1175/BAMS-D-24-0101.1


https://www.bbc.co.uk/news/entertainment-arts-67098028
#ClimateChange #Climate

Simon Armitage: Poet laureate on 'life-changing' visit to the Arctic
Simon Armitage says poets can convey climate change in a way that scientists and journalists can't.By Ian Youngs (BBC News)